
|
|
|
 |
 |
 |
|
EGG‑NEWS.com
Egg Industry News, Comments & More by
Simon M.Shane
|
|
 |
|
 |
|
 |
Egg Industry Statistics and Reports
USDA Grain Stocks Report
|
04/28/2024 |
|
 The USDA quarterly Grain Stocks Report released on March 28th 2024, documented storage of corn and soybeans, classified according to on-site and remote facilities including elevators and commercial installations. Quantities of the two major ingredients as determined by USD-NASS, relevant to the cost of poultry production were:- The USDA quarterly Grain Stocks Report released on March 28th 2024, documented storage of corn and soybeans, classified according to on-site and remote facilities including elevators and commercial installations. Quantities of the two major ingredients as determined by USD-NASS, relevant to the cost of poultry production were:-
“Corn stocks in all positions on March 1, 2024 totaled 8.35 billion bushels equivalent to 54.4 percent of the 2023 crop, up 13 percent from March 1, 2023. Of the total stocks, 5.08 billion bushels (60.8 percent of total) were stored on farms, up 24 percent from a year earlier. Off-farm stocks, at 3.27 billion bushels, are down 1 percent from a year ago. The indicated December 2023 to February 2024 disappearance is 3.82 billion bushels, compared with 3.42 billion bushels during the same period last year”.
“Soybeans stored in all positions on March 1, 2024 totaled 1.85 billion bushels equivalent to 44.5 percent of the 2023 crop, up 9 percent from March 1, 2023. Soybean stocks stored on farms are estimated at 933 million bushels, (50.4 percent of total) up 24 percent from a year ago. Off-farm stocks, at 912 million bushels, are down 3 percent from last March. Indicated disappearance for the December 2023 - February 2024 quarter totaled 1.16 billion bushels, down 13 percent from the same period a year earlier”. same period a year earlier”.
Prices and commentary are incorporated in the Weekly Energy, Economy and Commodity Report posted each week and a summary of the WASDE #646 released on March 8th is retrievable under the STATISTICS tab.

|
Crop Progress
|
04/15/2024 |
|
Status of the 2024 Corn and Soybean Crops
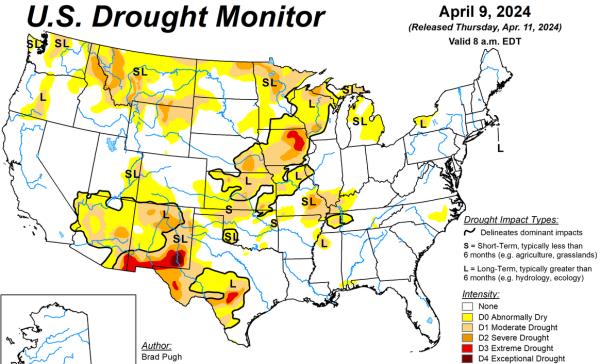
The USDA Crop Progress Report released on April 15th documented planting for the 2024 soybean and corn season. Farmers are in fields with relatively dry conditions in half of the eight major states producing corn and soybeans allowing rapid seeding of prepared acreage. The “big-eight” (IL, IN, IA, KS, MI, MN and OH) collectively averaged 3.5 days suitable for field work this past week ranging from 0.7 days (OH) to 6.3 days (KS)
Based on the sum of the “adequate” and “surplus” categories, surface and subsoil moisture levels were equivalent to the corresponding week in 2023. For the past week surface and subsoil moisture values were 70 and 66 percent respectively for the two highest categories. These levels were similar to the previous year with values of 66 percent and 66 percent respectively for the two highest categories, demonstrating an acceptable pre-planting situation. It is to early in the expected transition to an El Nino event to predict any impact on crop condition in coming weeks. If dry and warm weather in corn and soy areas occurs yield may be depressed depending on timing and severity.
Reference is made to the April 11th WASDE Report #647 under the STATISTICS TAB and the weekly Commodity, Economy and Energy Report in this edition, documenting acreage to be harvested, yields, weekly prices and ending stocks.
| |
WEEK ENDING |
|
|
Crop
|
March 31st 2024
|
April 7th 2024
|
5-Year Average
|
|
Corn planted
(18 states) (%)
|
3
|
6
|
5 |
|
Soybean planted
(18 states) (%)
|
0
|
3
|
1
|
| |
|
|
|
|

|
|
|
Crop Condition
(pending USDA reports)
|
V. Poor |
Poor
|
Fair
|
Good |
Excellent |
|
Corn 2024 (%)
Corn 2023 (%)
|
|
|
|
|
|
|
Soybeans 2024 (%)
Soybeans 2023 (%)
|
|
|
|
|
|
| |
|
|
|
|
|
|
|
|
|
Parameter 48 States
|
V. Short |
Short
|
Adequate
|
Surplus |
| Topsoil Moisture: |
|
|
|
|
|
Past Week
Past Year
|
8
11
|
22
18
|
56
59
|
14
12
|
| Subsoil Moisture: |
|
|
|
|
|
Past Week
Past Year
|
10
13
|
24
21
|
55
57
|
11
9
|
| |
|
|
|
|
|
 |
|
|
EGG-NEWS will report on the progress of the two major crops as monitored by the USDA through to the end of the 2024 harvest in November.
|
USDA-WASDE REPORT #647, April 11th 2024
|
04/11/2024 |
|
OVERVIEW

The USDA provided pre-planting values for the production of corn and soybeans in the April 11th World Agriculture Supply and Demand Estimates (WASDE) #647, reflecting the anticipated 2024 crop. Most values were understandably unchanged from the March edition given the month and are based on projections of acreage, yield, carry-forward levels from 2023, and with realistic assumptions of domestic use and exports giving rise to ending stocks.
The April 11th WASDE report predicted that corn would be harvested from 86.5 million acres, unchanged since February. The soybean crop will be harvested from 82.4 million acres also unchanged.
The most recent report retained the yield value for the 2024 corn crop at 177.3 bushels per acre. By comparison yield was 174.9 bushels per acre in 2023. The soybean yield was held at 50.6 bushels per acre compared to 49.9 bushels per acre in 2023.
The April 2024 USDA projection for the ending stocks of corn was 2,152 million bushels, down 2.3 percent from 2,172 million bushels in the March WASDE. The April 2024 USDA projection for the ending stock of soybeans was 340 million bushels, up 7.9 percent from 315 million bushels in March.
The April 2024 WASDE lowered the ex-farm price of corn by 5 cents to 470 cents per bushel. The projected average season price for soybeans was reduced 10 cents per bushel from the March WASDE of 1,255 cents per bushel. Soybean Meal was unchanged at $380 per ton.
Projections for world production included in the March 2024 WASDE report reflect the most recent estimates for commodities in the Southern Hemisphere with an emphasis on Argentine and Brazil. Economists also evaluated the likely impacts from hostilities in Ukraine with occupation of ten percent of the Nation’s land area by the Russian Federation and following extensive destruction of agricultural infrastructure. It is evident that production and hence exports of wheat, corn and sunflower from Ukraine will be reduced compared to pre-war averages. Exports from Ukraine have been restored following the collapse of the Black Sea Grain Initiative and destruction of Black Sea and Danube Delta port installations. These adversities have been partly overcome by aggressive naval action allowing the “Humanitarian Corridor” that traverses the national waters of friendly countries along the western Black Sea coast.
It is accepted that USDA projections for export are also based on the perceived intentions and needs of China. This Nation has sharply curtailed purchases of commodities and especially U.S. soybeans during the current market year despite drought and taking into effect relaxation of COVID restrictions on consumers with higher demand.
Reports on volumes of commodities exported are included in weekly editions of EGG-NEWS, derived from published USDA-FAS sales data.

|
Commodity Report
|
04/11/2024 |
|
WEEKLY ECONOMY, ENERGY AND COMMODITY REPORT: April 11th 2024.
OVERVIEW
 Prices for corn, soybeans and soybean meal were approximately one percent lower compared to last week. Prices were influenced by technical selling arising from geopolitical concerns and revised projections for crop sizes in Brazil and Argentine. Secondary factors included disruption in shipping in the Red Sea and Panama Canal, carryover from the 2023 U.S. crop, export orders and predicted ending stocks of corn and soybeans for the 2024 crop. There was no apparent response to release of the April WASDE that retained projections for production and ending stocks from the March report although prior to release of planting intentions. Prices for corn, soybeans and soybean meal were approximately one percent lower compared to last week. Prices were influenced by technical selling arising from geopolitical concerns and revised projections for crop sizes in Brazil and Argentine. Secondary factors included disruption in shipping in the Red Sea and Panama Canal, carryover from the 2023 U.S. crop, export orders and predicted ending stocks of corn and soybeans for the 2024 crop. There was no apparent response to release of the April WASDE that retained projections for production and ending stocks from the March report although prior to release of planting intentions.
At 12H00 on April 11th the CME price for corn was down 0.7 percent compared to the previous week to 431 cents per bushel for May delivery. Corn price was influenced by higher ethanol demand and the proportionally high ending stock of corn from the 2023 crop. Export orders for the current market year have increased in response to lower prices. Volumes and prices are indirectly influenced by higher wheat prices, events in the Black and Red Seas. Orders by China resumed at the end of the 2022-2023 market-year and have extended through March despite a slightly higher Dollar Index offset by a low FOB prices although with increased ocean freight. Total exports for the current market year are 34.2 percent higher than for the corresponding week during the 2022-2023 year.
Soybeans traded at 1,162 cents per bushel for May 2024 delivery down 1.0 percent over the week. Lower prices were attributed to short covering, farm selling and availability from the 2024 Brazil and Argentine harvests. Total exports for the current market year are 18.3 percent lower than for the corresponding week in the 2022-2023 year.
Soybean meal traded at $334 per ton for May delivery, down 0.6 percent compared to $332 per ton for last week. Price was influenced by demand coupled with high crush volumes for consecutive months from December 2023 onwards but with lower volume in January due to the impact of cold weather. Price will fluctuate to reflect the CME price for soybeans and the demand for biodiesel despite the adverse financial situation in this sector. The market previously responded to the increased 2023 crop and higher stocks together with projections for 2024 unchanged from March in the April WASDE Report.
WTI was 0.5 percent higher from last week to $85.92 at 13H00 GMT on April 10th with moderate world demand in relation to supply. Price is higher partly due to disruption in shipping in the Red Sea, and turbulence in the Middle East but is countered by U.S. production attaining 13.3 million barrels per day in March with ample reserves. An upward trajectory in price may occur if production cuts by OPEC amounting to 2 million barrels per day and extended through June actually materialize. There was stability in price during the week ($85.15 to $86.43 range). Crude oil inventory in the U.S., other than the Strategic Reserve, was down 0.5 percent to 33.0 million barrels last week. High U.S. production is constraining domestic and international prices but the rise in energy cost during past weeks is reflected in ‘sticky’ inflation restraining the FOMC from lowering the benchmark interest rate.
Factors influencing commodity prices in either direction over the past four weeks included:-
- Weather conditions in areas of the World growing corn and oilseeds especially in Brazil and also Argentine with favorable rain recently under the influence of a strong La Nina The 2023 U.S. harvest was completed ahead of the corresponding weeks in 2022 with higher carryover (Downward pressure on prices). Planting has commenced for the “new” crop of 2024.
- Geopolitical considerations continue to move markets, especially in the Mideast. Ongoing attacks on Ukraine port facilities have impacted prices of wheat, corn, oilseeds and vegetable oils. Loaded bulk vessels are sailing from Black Sea and Danube River ports using the ‘Humanitarian Corridor” to various destinations. This route is operational despite threats by the Russian Federation to mine the entrance to ports and deployment of airborne missiles. Exports from Ukraine are approaching 1.5 million metric tons per week with a total of 26 million metric tons market year through February, down 11 percent from the equivalent period for 2022-2023 year. Grain production in Ukraine during the current year will be lower than 2022/2023 (Downward pressure on corn and wheat and an indirect effect on soybeans)
- Macroeconomic U.S. factors:-
- Most economists in academia and the private sector are confident of a “soft landing” for the economy following the release of revised Q4 2023 GDP and recent releases of economic parameters including the CPI and anticipated PPI and a decline in bond rates. Annual inflation as measured by CPI declined from 8.9 percent in June 2022 to 3.5 percent in March 2024. This is in part a response to a series of 11 FOMC rate raises that curbed inflation and cooled the labor market but without precipitating unemployment. There is evident stability in the bank sectors in both the U.S. and Europe. Large U.S. banks passed stringent mid-year “stress tests”. There is now concern over regional banks with exposure to commercial real estate. A rise in energy prices is contributing to persistence of inflation.
- The Federal Reserve held the benchmark interest rate steady at the monthly FOMC meeting on March 20th 2024, the fifth sequential pause. The Federal Reserve commentary indicated that the rate would be held at 5.25 percent until a pivot with possibly less than two reductions of 25 basis points each in 2024, after the September meeting at the earliest. Chairman Powell in Congressional testimony and documented in FOMC minutes has indicated that decisions would be based on data and demonstrable progress in reducing inflation towards an annual 2.0 percent target by mid-2025. Market optimism with projections of five reductions during 2024 was evidently premature.
- The March 28th Bureau of Economic Affairs announcement of the advanced estimate of Q4 GDP confirmed a value of 3.4 percent, slightly above the previous estimate of 3.2 percent. The rise was attributed to increased consumer and government sector spending and investment in inventory. Growth in GDP attained 2.5 percent in 2023 up from 1.9 percent in 2022.
- On March 29th the Bureau of Economic Analysis released the February Personal Consumption and Expenditure Price Index (excluding food and energy) that was up 0.3 percent from the previous month to 2.8 percent year-over-year. This was in line with estimates. Food prices increased 0.1 percent but energy was up 2.3 percent in March. The Headline PCE Index was up 2.5 percent year-over-year also corresponding to estimates. The price of goods increased 0.1 percent from February and was higher than services at 0.3 percent. Consumer spending was up 0.8 percent, above estimates and compared with 0.2 percent in January, impacted by weather. The headline PCE is closely followed by the Federal Reserve and confirms declining inflation.
- The April 10th Bureau of Labor Statistics release of the March 2024 CPI confirmed a 0.4 percent increase from February, and 0.1 percent above forecast. The annual increase of 3.5 percent was up from 3.2 percent in February and higher than the anticipated value. The increase in the core value (excluding food and energy) was 0.4 percent from February and 3.8 percent for the 12-month period, and estimates. Food at home was unchanged from the previous month. The category of meat, fish and poultry was up collectively by 0.9 percent with eggs up 4.6 percent from the previous month. Food away from home was up 0.3 percent from February. On an annual basis all food was up 2.2 percent with food at home up 1.2 percent and food away from home up 4.2 percent. Energy was up 1.1 percent together with natural gas (-3.2 percent) in March. The shelter category was up 0.4 percent for the month and 5.7 percent over the past year. The macro trend is inclining towards reduced inflation due to a fall in energy prices but this category has recently moved up, detracting from deflation. The CPI heavily influences FOMC rate decisions.
- The March Producer Price Index for Final Demand (PPI) released on April 11th was up by 0.2 percent from February compared to an expectation of 0.3 percent. The PPI was up 2.1 percent over the past 12-months. This is compared to a 6.4 percent increase in 2022. The core PPI value excluding volatile fuel and food, was up 0.2 percent for March and up 2.8 percent for the 12-month period. Food was up 0.8 percent compared to a 1.1 percent increase in February.
- A Federal Reserve release on March 15th confirmed that industrial production rose 0.1 percent in February. Production was adversely affected by inclement weather during January with plant closures. Capacity utilization was unchanged at 78.3 percent, 1.3 percent below the 1972-2020 average.
- The March 26th report on Durable Goods Ordered during February 2024 was higher by 1.4 percent to $278 Billion after two months of declines. Transportation and specifically aircraft orders were up 3.3 percent. Excluding the Transportation component, new orders increased by 0.5 percent in February compared to January impacted by inclement weather. Shipments of durable goods increased 1.2 percent following a fall of 0.8 percent in January 2024.
- The March14th release of retail sales data showed a monthly rise of 0.6 percent in February. This value is compared to the revised 0.4 percent rise in December 2023. Retail sales in January were affected by harsh winter storms and a change in the basis of calculation. The Federal Reserve FOMC closely monitors this index as a measure of the trend in inflation.
- The April 1st release by the Institute for Supply Management (ISM®) documented the Manufacturing Index for March at 50.3 up from 47.8 in February and above the consensus of 48.4. New orders increased to 51.6 (49.2, February) and Production attained 54.6 (48.4, February).
- The April 1st release of the S&P Global U.S. Manufacturing PMI fell to 51.9 in March from a revised 52.2 in February but above the March 2023 value of 46.3.
- The Conference Board Consumer Confidence Index released on March 26th for February/March, rose to 104.7 points. This reading was almost unchanged from a revised 104.8 for the preceding four-week period. The Present Situation Index was up to 157.0 in March from 147.6 in February. The Expectations Index fell to 73.8 in March from 76.3 in February with values below 80.0 suggesting a future recession
- The March 15th University of Michigan Index of Consumer Sentiment fell to 75.5 for March down from a revised 76.5 in February. The Index was up from 63.5 percent in April 2023. Both the Current Economic Index (79.4unchanged from February) and the Index of Consumer Expectations (74.6 down from 75.2 in February) denote a cautious increase in consumer sentiment influenced by lower interest rates and moderating inflation despite geopolitical concerns.
- Non-farm payrolls added 303,000 for March, as documented by the Bureau of Labor Statistics on April 5th. This was more than the anticipated 214,000, and compares to the revised February value of 270,000. The increase is attributed to workers in the health care and government sectors. The unemployment rate fell to 3.8 percent with 15 million unemployed. Real average weekly earnings for March showed a 0.3 percent increase over February. Average hours worked rose 0.1 percent to 34.4 per week in March. Labor participation increased fractionally from 62.5 percent in February to 62.7 percent in March. Wage rates increased 4.1 percent over 12-months, the lowest gain since June 2021. Wage rates are closely followed by the Federal Reserve FOMC.
- The Bureau of Labor Statistics Job Openings and Labor Survey report released on April 2nd estimated 8.8 million job openings at the end of February, down 100,000 (-0.1 percent) from January 2024 and consistent with estimates. The February job openings number was the lowest value in 34 months and compares with the March 2022 value of 12.2 million during COVID.
- The seasonally adjusted initial jobless claims figure of 211,000 released on April 11th was down from the revised seasonally adjusted 211,000 for the week ending April 6th but lower than the Reuter’s estimate of 215,000. The four-week moving average increased by 250 to 215,000 The Bureau of Labor Statistics estimated 1.82 million continuing claims for the week ending March 30th up 28,000 from the previous week. There is evidence from data over the past three months that the labor market is cooling despite sporadic weekly fluctuation in new claims.
- The April 5th Bureau of Labor Statistics report recorded a 0.7 percent increase in non-Farm Productivity for 2023. Output increased by 2.6 percent with a 1.9 percent increase in inputs of labor and capital. Hours Worked was up by 1.3 percent in 2023
- The ADP® reported on April 3rd that private payrolls increased by 184,000 in March, up 29,000 from the revised 155,000 in January and compared to the Bloomberg estimate of 150,000 jobs. The increase in employment was mostly in the construction, financial services and manufacturing sectors. Annual pay was up 5.1 percent year-over-year unchanged from February. The increase will not directly influence the probability of short-term future changes in interest rate since the ADP® is regarded by the FOMC as an unreliable statistic
FACTORS INFLUENCING COMMODITY PRICES
- The 2023 harvests of corn and soybeans were completed by late November 2023. The April 11th WASDE provided a projection for acreage to be planted, yields, crop size and ending stocks for the 2024 crop.
- It is evident that both polarization in the closely divided chambers of Congress and intra-party conflict between and among both sides of the aisle in the House delayed adoption of appropriations bills. Passage of the 2023 Farm Bill will be contentious and is subject to a 12-month extension as a stop-gap measure. Progress on the 2023 Farm Bill has been impeded by contention over SNAP eligibility and other entitlements that collectively represent 75 percent of total expenditure. The August 2nd downgrade of U.S. debt from AAA to AA+ by Fitch Ratings recognizes Congressional dysfunction. On November 10th 2023 Moody’s downgraded U.S. credibility from ‘stable’ to ‘negative’ based on an inability to pass required fiscal legislation. After four Continuing Resolutions the House and Senate passed six appropriations bills including the FDA and USDA, avoiding a March 8th partial shutdown of the Federal Government. Agreement was concluded on the remaining appropriations bills on March 23rd maintaining Federal funding through October 2024. Currently the Speaker of the House is experiencing difficulty in arranging for passage of legislation.
- The delayed 2023 Farm Bill is mired in conflict in both the House and Senate. There is no consensus on major issues comprising the magnitude of SNAP payments and eligibility and requested price supports for crops. The Chair of the Senate Agriculture Committee Sen. Debbie Stabenow (D-MI) is standing firm on maintaining both SNAP-WIC benefits and climate remediation funding even if the Farm Bill is delayed through to the 119th Congress
- The April 11th WASDE #647 Projected both corn and soybean production parameters with a potential record corn harvest for the 2024 crop. There will be ample world availability of ingredients although inequitable distribution will result in shortages in some nations. Soybean exports will comprise 38.2 percent of the 2024 U.S. crop with a 7.7 percent increase in ending stock to 340 million bushels as compared to the March WASDE Report.
- Rabobank projected the soybean crop in Brazil at 153 million metric tons on April 4th. This value is higher than the projection by CONAB (the Soy production association in Brazil) at the midpoint of the soybean harvest, of 147 million metric tons (5,401 million bushels) down from a previous estimate of 155 million metric tons (5,695 million bushels). Exports of 100 million metric tons (3,674 million bushels). It is anticipated that Brazil will crush 56 million metric tons (2,057 million bushels). If CONAB is correct the harvest will be 7 million metric tons (269 million bushels) lower than the 2023 record crop. Brazil exported 7.0 million metric tons (257 million bushels) of soybeans to China over the first two months of 2024, double the quantity shipped to this nation over the corresponding two months in 2023.
- Corn production in Brazil for the 2023-2024 market year will attain 124 million metric tons (4,801 million bushels) from all three sequential harvests. But down seven percent from the previous year. Brazil is projected to export of 54 million metric tons (2,125 million bushels). Argentine will produce 50 million metric tons of corn (1,968 million bushels), double compared to the previous year impacted by drought. (Lower prices in the future subject to favorable reports on crop progress and actual harvests)
- The Dollar Index (DXY) was 105.2 at noon on April 10th, up 1.0 point from last week responding to CPI data suggesting retention of current benchmark interest rates for a prolonged period. The DXY has ranged from 99.0 to 107.0 over the past 52 weeks. The dollar index influences timing and volume of export orders and indirectly the price of WTI crude.
EXPORTS
The FAS Export Report for corn, released on April 11th for the week ending April 4th confirmed that outstanding export orders for corn amounted to 15.60 million metric tons (614.02 million bushels). Net orders for the past week for the 2023-2024 market year amounted to 0.33 million metric tons (12.79 million bushels). Shipments recorded during the past working week amounted to 1.55 million metric tons (61.28 million bushels). For the current market year to date cumulative export of 28.88 million metric tons (1,125 million bushels) is 34.2 percent higher compared to the equivalent week of the previous market year. For market year 2024-2025 outstanding orders attained 1.76 million metric tons (69.55 million bushels) with 9,300 metric tons (373,920 bushels) ordered this past week
(Conversion 39.36 bushels per metric ton. Quantities in metric tons rounded to 0.1 million)
The FAS Export Report for soybeans covering the week ending April 4th reflecting market year 2023-2024, recorded outstanding export orders amounting to 3.59 million metric tons (11.22 million bushels). Net orders this past week attained 0.19 million metric tons (7.12 million bushels). Shipments for the past working week attained 0.50 million metric tons (18.48 million bushels). For the current market year to date cumulative exports of 37.26 million metric tons (1,369 million bushels) are 18.3 percent lower compared to the equivalent week of the previous market year. Outstanding orders for the 2024-2025 market year amount to 0.47 million metric tons metric tons (17.27 million bushels) with no orders tons this past week.
(Conversion 36.74 bushels per metric ton)
For the week ending April 4th 2023 outstanding orders for soybean meal and cake attained 3.07 million metric tons. Net orders this week for soybean meal and cake amounted to 187,900 metric tons. During the past week 280,500 metric tons of meal and cake combined was shipped. The quantity exported to date is 15.2 percent higher than the volume for the corresponding weeks of the previous market year. For the next market year outstanding sales have attained 308,100 metric tons with 53,400 tons ordered this past week.
|
Egg Week
|
04/10/2024 |
|
USDA Weekly Egg Price and Inventory Report, April 10th 2024.
Market Overview
- The average wholesale unit revenue values for Midwest Extra-large, Large and Medium sizes were unchanged this past week. Wholesale prices for Midwest in cartons were approximately 20 cents per dozen above the 3-year average of $2.40 per dozen for the corresponding week in 2023. This past week shell egg inventory was up by a noteworthy 10.3 percent, following a fall of 0.1 percent the previous week. Although there has been a weekly increase in pullet flocks transferred to laying houses, hen numbers are constrained by the loss of close to 13 million hens due to HPAI on twelve complexes holding from 250,000 to 2.6 million hens during the 4th Quarter of 2023. Pullets are in short supply with losses of 2.5 million growing birds mainly in California.
- This past week chains apparently narrowed the spread between delivered cost and shelf price. This could result in a potential reduction in generic stock with a proportional rise in demand but only with constant re-ordering to fill the pipeline through April. Discounters are holding prices on generics influencing mainstream retail stores. Eggs are still highly competitive in price against the comparable costs for other protein foods.
- Total industry inventory was up by 8.1 percent overall this past week to 1.63 million cases with a concurrent 0.8 percent decrease in breaking stock, following a 3.7 percent fall during the preceding processing week. Demand for egg products resume after the Easter weekend with more home baking and entertaining. Egg products are required for the food service and manufacturing sectors and exports increased in February. USDA Benchmark wholesale price for eggs in cartons was approximately $0.70 per dozen lower than the corresponding week in 2023.
- It is now apparent that the inventory held by chains and other significant distributors may be more important over the short term in establishing wholesale price compared to the USDA regional inventory figures. Changes in stock held by DCs and in the pipeline as determined by weekly orders are probably responsible for small cyclic fluctuation in weekly industry stock, especially into and after a holiday weekend.
- Cases of HPAI in the commercial poultry industry and backyard (non-commercial WOAH) flocks tapered during the first quarter of 2024, coincident with the end of the Fall migration of waterfowl that was extended in late 2023 by mild weather. The emergence of the infection in a large complex holding 1.6 million hens and 340,000 pullets in western Texas suggests a reoccurrence as northward spring migration commences. The second case in Michigan involving a 2-million hen complex may have been an indirect extension from an infected dairy herd although an epidemiologic evaluation is in progress. The number and extent of future possible outbreaks during the spring and fall months of 2024 cannot be projected but sporadic cases in backyard poultry and dairy herds in six widely diverse states is a cause for concern. More surveillance information should be released by USDA-APHIS as it becomes available concerning the prevalence rate of carriers among resident domestic free-living birds and a review of molecular and field epidemiology for the 2022 spring and fall waves of HPAI. The USDA has yet to identify specific modes of transmission for the 2022-2023 epornitic including likely airborne spread from wild birds and their excreta over short distances.
- The current relationship between producers and chain buyers based on a single commercial price discovery system constitutes an impediment to a free market. The benchmark price appears to amplify both downward and upward swings as evidenced over the past two years. A CME quotation based on Midwest Large, reflecting demand relative to supply would be more equitable. If feed cost is determined by CME ingredient prices then generic shell eggs should be subject to a Midwest Large quotation.
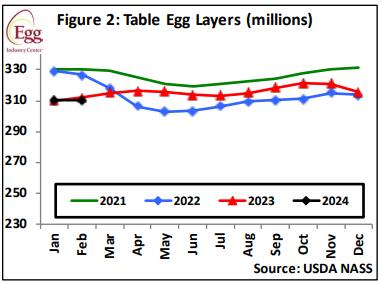
- According to the USDA the U.S. flock in production was apparently down by 0.1 million hens (<0.1 percent) to a new level of 306.3 million for the week ending April 10th The stated total flock of 311.9 million included about one million molted hens that will resume lay during coming weeks plus 4.5 million pullets scheduled to attain production. Given the latest figures it is estimated that the producing flock is at least 17 to 19 million hens lower than before the onset of HPAI in 2022. In January 2024 the USDA adjusted figures to account for depopulation of 13 million hens spread over the last quarter of 2023. There were evident discrepancies between published figures and the theoretical number of hens taking into account known losses and predetermined pullet replacements. The early April loss of 3.5 million hens is not reflected in data released over the past two weeks. It is hoped that the USDA Agency responsible for publication of flock size will coordinate with APHIS to record the number of depleted flocks and promptly provide accurate data.
- The ex-farm price for breaking stock (rounded to one cent) was down 1.6 percent to $1.58 per dozen.Checks delivered to Midwest plants were unchanged at $1.42 per dozen this past week. Prices for breaking stock should follow the wholesale price for shell eggs usually with a lag of about one to two weeks.
The Week in Review
Prices
According to the USDA Egg Market News Reports released on April 8th 2024, the Midwest wholesale price (rounded to one cent) for Extra-large was unchanged from last week to $2.43 per dozen. Large was unchanged at $2.41 cents per dozen. Mediums were unchanged at $2.30 per dozen delivered to DCs. Prices should be compared to the USDA benchmark average 4-Region blended nest-run cost of 75.3 cents per dozen as determined by the Egg Industry Center based on USDA data for March 2024. This value excludes provisions for packing, packaging materials and transport, amounting to 57 cents per dozen as determined in mid-2023 from an EIC survey (with low response) and now realistically 60 cents per dozen.
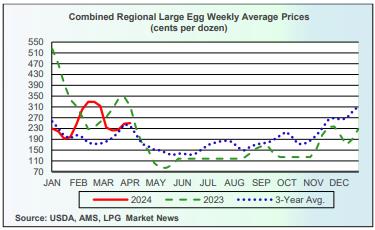
Currently producers of generic shell eggs should be operating with positive margins irrespective of region and customer-supply agreements. The progression of prices during 2023 and 2024 to date is depicted in the USDA chart reflecting three years of data, updated weekly.
The April 8th edition of the USDA Egg Market News Report confirmed that the USDA Combined Region value (rounded to the nearest cent), was up 2 cents per dozen to $2.50 per dozen delivered to warehouses for the week ending April 2nd 2024. This average price lags current benchmark Midwest weekly values by one week. The USDA Combined range for Large in the Midwest was $2.41 per dozen. At the high end of the range, the price in the South Central region attained $2.57 per dozen. The USDA Combined Price last week was approximately 20 cents per dozen above the 3-year average of $2.20 per dozen. This past week Midwest Large was approximately $0.70 per dozen below the corresponding week in 2023 that was falling from a peak price to $3.10 per dozen as production recovered from HPAI depletion and to declining market demand.
Flock Size
Previously the loss of approximately 13 million hens due to HPAI during the fourth quarter was not reflected in weekly USDA figures until the beginning of February. The loss of 3.5 million hens in early April is not reflected in current data. Increases in flock size during late February and early March amounted to fractions of a percent. The USDA has now published data to reflect previous losses due to HPAI depopulation and molted flocks reentering production during the post-Easter period but has yet to update figures for depletion in April.
Given the importance of weekly flock numbers to pricing, accurate values for producing and total flock are required by producers.
According to the USDA the number of producing hens reflecting April 3rd 2024 (rounded to 0.1 million) was apparently down 0.2 million to 306.4 million. The total U.S. flock includes about one million molted hens due to return to production Approximately 5.0 million pullets on average reach maturity each week, based on USDA monthly chick-hatch data for 20-weeks previously. The increase is offset by routine flock depletion and an additional loss of approximately 13 million hens during the last quarter of 2023. To date some flocks have been replaced but 3.5 million hens were depleted since the beginning of April. Based on inventory level and prices, the population of hens producing table eggs and breaking stock should now be producing at or below post-Easter demand by consumers. Industrial and food service off-take is increasing, approaching pre-COVID levels. Prices will continue to fluctuate but have shown atypical seasonal stability instead of a decline.
|
Egg Month
|
04/08/2024 |
|
REVIEW OF MARCH 2024 EGG PRODUCTION COSTS AND STATISTICS.
Commencing in 2024 the EIC justifiably separated the production costs and unit revenue values for eggs derived from caged and cage-free flocks. Accordingly, EGG-NEWS will continue to summarize data but will consolidate production and export statistics for the U.S. egg industry as a total and compare financial data for the two shell-egg categories.
FEBRUARY HIGHLIGHTS
- March 2024 USDA ex-farm blended USDA nest-run, benchmark price for conventional eggs from caged hens was 187 cents per dozen, down 64 cents per dozen or 25.5 percent from the February 2024 value of 251 cents per dozen. For comparison, average monthly USDA benchmark price over 2023 was 146.0 cents per dozen with a range of 323 cents per dozen in January down to a low of 57 cents in May. Stock levels and prices prior to the onset of flock depletions due to HPAI indicated a relative seasonal balance between supply and demand. Future nest-run and wholesale prices will be largely dependent on consumer demand for shell eggs and products and the rate of replacement of pullets and hens depleted due to HPAI. Other considerations include diversion to shell sales from the egg-breaking sector in an interconnected industry.
- Fluctuation in wholesale price is attributed in part to the amplification of upward and downward swings associated with the commercial benchmark price discovery system in use. Restoration of seasonal prices commenced midway through the fourth quarter of 2023 with a plateau after Christmas followed by a seasonal decline through January 2024. A substantial rise in price occurred during February but with a sharp decline thereafter to mid-March. An unknown factor in future pricing will be the incidence rate and severity of highly pathogenic avian influenza in spring months with northward migration of waterfowl. Close to 13 million hens and 2.5 million pullets were depopulated during the fourth quarter of 2023 among five states with heavy losses in California. Approximately 3.5 million hens were depleted in two outbreaks (TX and MI) during early April.
- March 2024 USDA average nest-run production cost for generic eggs from caged flocks over four regions (excluding SW and West), applying updated inputs was down 0.7 cents per dozen to 75.3 cents per dozen compared to the February 2024 value of 76.0 cents per dozen, mainly attributable to a 1.7 percent lower average feed cost per dozen. Approximately 60 cents per dozen should be added to the USDA benchmark nest-run cost to cover processing, packing material and transport to establish a realistic price as delivered to warehouses.
- March 2024 USDA benchmark nest-run margin attained a positive value of 155.1 cents per dozen for generic eggs from caged flocks compared to a positive margin of 170.1 cents per dozen for January 2024. Average nest-run monthly margin over 2023 was 64.2 cents per dozen compared to 155 cents per dozen in 2022. This differential was mainly due to higher prices following HPAI-depletion of flocks. It is emphasized that the U.S. benchmark price reflects nest-run conventional eggs.
- The March 2024 national flock in production (over 30,000 hens per farm) was stated by the USDA to be down 0.1 million hens (rounded) to 294.6 compared to the revised February 2024 value of 294.7 million. This figure apparently takes into account depletion of 4.2million hens during December 2023 that were not recorded in the month. Approximately 3.0 million hens returned to production from molt in March together with projected maturation of 23.1 million pullets, with this number offset by depletion of spent flocks. During the fourth quarter of 2023 approximately 13 million hens and 2.5 million pullets were depopulated due to HPAI in five states.
- February 2024 pullet chick hatch of 27.9 million was up 6.9 percent or 1.8 million chicks from January 2024.
- February 2024 exports of shell eggs and products combined was up 62.5 percent from January 2024 to 641,300 case equivalents representing the theoretical production of 8.5 million hens. The increase was attributed to greater demand for shell eggs by Canada and egg products by Japan and the E.U. among other importing countries.
TABLES SHOWING KEY PARAMETERS FOR MARCH 2024.
Summary tables for the latest USDA March 2024 flock statistics, costs and unit prices made available by the EIC on April 8th 2024 are arranged, summarized, tabulated and compared with values from the previous March 13th 2024 posting reflecting February 2024 costs and production data as applicable. Monthly comparisons of production data and costs are based on revised USDA values.
VOLUMES OF PRODUCTION REFLECTING THE ENTIRE INDUSTRY
|
PARAMETER
|
MARCH 2024
|
FEBRUARY 2024
|
|
Table-strain eggs in incubators
|
56.6 million (Mar.)
|
59.1 million (Feb.)
|
|
Pullet chicks hatched
|
27.9 million (Feb.)
|
26.6* million (Jan.)
|
|
Pullets to be housed 5 months after hatch
|
26.9 million (July)
|
23.2* million (June)
|
|
EIC 2023 December 1st U.S. total flock projection
|
328.9 (Mar.)
|
328.0 million (Feb.)
|
|
National Flock in farms over 30,000
|
294.6million (Feb.)
|
294.7* million (Jan.)
|
|
National egg-producing flock
|
310.4 million (Feb.)
|
310.5* million (Jan.)
|
|
Cage-free flock excluding organic
|
106.5 million (Mar.)
|
106.5 million (Feb.)
|
|
Proportion of flocks in molt or post-molt
|
11.2% (Mar.)
|
11.2% (Feb.)
|
|
Total of hens in National flock, 1st cycle (estimate)
|
275.6 million (Feb.)
|
275.6 million (Jan.)
|
|
Total U.S. Eggs produced (billion)
|
7.40* February 2024
|
7.96* January 2024
|
|
Total Cage-Free hens in production
|
124.8 million (Mar.)
14.7% Organic
|
124.8 million (Feb.)
14.7% Organic
|
|
“Top-5” States hen population (USDA)1
|
145.0 million (Feb.)
|
148.5 million (Jan.)
|
* Revised USDA/EIC
Notes 1. Texas excluded to maintain confidentiality
|
Egg Exports
|
04/06/2024 |
|
Export of Shell Eggs and Products, January-February 2024.
 Exports of shell eggs during the 12-month period commencing March 2022 were constrained by availability due to progressive and cumulative depletion of 44 million hens as a result of HPAI divided among spring and fall waves. The national flock was about 20 million hens lower than the pre-HPAI complement on an average weekly basis during 2022. Sharp rises in price as a result of supply-demand disequilibrium made U.S. export prices non-competitive as denoted by lower volumes over successive months from March 2022. Egg products were also impacted but to a lesser extent than shell eggs. During June 2023 shell and product exports combined represented 2.5 percent of total production, more than double the volume recorded in January 2023 but exports declined in July to 1.9 percent of production by U.S. flocks. At the present time the national flock is approximately 18 million hens lower than pre-HPAI levels with relatively high prices sufficient to constrain exports of shell eggs. Combined shell and product exports in December 2023 represented 2.6 percent of the output of the national flock. It is questioned whether lost markets other than the USMCA and Caribbean nations will be reclaimed over the intermediate term. Sporadic and short-term exports may be made to various nations based on supply disruption caused by HPAI. Exports of shell eggs during the 12-month period commencing March 2022 were constrained by availability due to progressive and cumulative depletion of 44 million hens as a result of HPAI divided among spring and fall waves. The national flock was about 20 million hens lower than the pre-HPAI complement on an average weekly basis during 2022. Sharp rises in price as a result of supply-demand disequilibrium made U.S. export prices non-competitive as denoted by lower volumes over successive months from March 2022. Egg products were also impacted but to a lesser extent than shell eggs. During June 2023 shell and product exports combined represented 2.5 percent of total production, more than double the volume recorded in January 2023 but exports declined in July to 1.9 percent of production by U.S. flocks. At the present time the national flock is approximately 18 million hens lower than pre-HPAI levels with relatively high prices sufficient to constrain exports of shell eggs. Combined shell and product exports in December 2023 represented 2.6 percent of the output of the national flock. It is questioned whether lost markets other than the USMCA and Caribbean nations will be reclaimed over the intermediate term. Sporadic and short-term exports may be made to various nations based on supply disruption caused by HPAI.
USDA-FAS data collated by USAPEEC, reflecting export volume and values for shell eggs and egg products are shown in the table below comparing 2023 with 2022:-
|
PRODUCT
|
Jan.-Feb. 2023
|
Jan.-Feb. 2024
|
Difference
|
|
Shell Eggs
|
|
|
|
|
Volume (m. dozen)
|
11.2
|
12.2
|
+1.0 (+8.9%)
|
|
Value ($ million)
|
30.4
|
24.1
|
-6.3 (-20.7%)
|
|
Unit Value ($/dozen)
|
2.71
|
1.98
|
-0.73 (-26.9%)
|
|
Egg Products
|
|
|
|
|
Volume (metric tons)
|
3,715
|
4,591
|
+876 (+23.6%)
|
|
Value ($ million)
|
21.3
|
22.4
|
+1.1 (+5.2%)
|
|
Unit Value ($/metric ton)
|
5,713
|
4,879
|
-854 (-14.9%)
|
U.S. EXPORTS OF SHELL EGG AND EGG PRODUCTS DURING
JANUARY-FEBRUARY 2024 COMPARED WITH 2023
SHELL EGGS
Shell egg exports from the U.S. during January-February 2024 increased by 9.9 percent in volume but declined 20.7 percent in total value compared to the corresponding months in 2023. Unit value declined 26.9 percent to $1.98 per dozen compared to January-February in 2023.
Canada was the leading importer of shell eggs during January-February 2024, with 8.1 million dozen representing 66.4 percent of volume and 64.7 percent of the $24.1 million total value of U.S. shipments of shell eggs. Unit price in January-February 2024 was $1.93 per dozen compared to $2.99 per dozen for consignments in February 2023. Imports by Canada are driven by consumer demand balanced against availability from the controlled supply situation. This inhibits flexibility necessitating imports from the U.S. to cater for demand. During February 2024 Canada imported 6.0 million dozen up 81.8 percent over the corresponding month in 2023. Value was up 30.3 percent to $11.6 million but unit value was 28.5 percent lower to $1.93 per dozen.
The Caribbean Region was a distant second in shell egg imports from the U.S. during January-February 2024, with 2.1 million dozen representing 17.2 percent of volume and 19.1 percent of the total value of U.S. shipments of shell eggs. Unit price in February 2024 was $2.19 per dozen
Mexico was the third-ranked importer of shell eggs in January-February 2024 with a volume of 0.5 million dozen representing 4.1 percent of export volume and 3.7 percent of value. This price discrepancy was due to a low unit value of $1.80 per dozen compared to an average value of $1.98 per dozen for all exports.
During January-February 2024 the next three significant importing regions, the Middle East, the E.U. and East Asia, (principally Hong Kong.) with a collective volume of 1.1 million dozen represented 19.8 percent of U.S. exports. Value of exports to these importing regions amounted to $1.6 million in January-February 2024 compared to $1.7 million in January-February 2023. Unit price for these importers in January-February 2024 averaged $1.45 per dozen, compared to the January-February 2024 average USDA export price of $1.98, per dozen, tray packed, excluding processing but with inland transport and outer cartons. The average 12-month trailing USDA benchmark price for nest-run large shell eggs was $1.40* per dozen weighted by high prices during shortages during the first quarter of 2023 resulting from depletion of flocks infected with HPAI.
*USDA 12-month USDA benchmark nest-run unit prices per dozen: $2.13; March, $2.74; April, $1.38; May, $0.60; June, $0.82; July, $0.83 and August, $0.90; September, $1.00; October, $0.89; November, $1.65; December, $1.81; January 2024, $1.72 and February, $2.51.
EGG PRODUCTS
The total volume of exported egg products during January-February 2024 increased 23.6 percent to 3,715 metric tons compared to January 2023. Total value of $22.4 million was higher by 5.2 percent compared to January-February 2023. Unit value decreased by 14.9 percent to $4,879 per ton compared to January-February 2023. During 2023 the U.S. exported 29,814 metric tons of egg products valued at $134.3 million with a unit price of $4,505 per metric ton. Fluctuation in unit price reflects the composition of exports and the relationship between World supply and demand. Ukraine is now restrained in production but India continues as a significant exporter.
Japan was the 1st-ranked importer by volume of egg products during January-February 2024 receiving 1,137 metric tons from the U.S. valued at $5.8 million representing 24.8 percent of volume and 25.8 percent of value with a unit price of $5,101 per metric ton. Volume for January-February 2024 was down by 17.3 percent and value was lower by 17.1 percent compared to January-February 2023. During February 2024 Japan imported 751 metric tons down 3.1 percent over the corresponding month in 2023. Value was down 9.1 percent to $4.0 million and unit value was 6.1 percent lower to $5,326 per metric ton. During 2023 Japan imported 10,352 metric tons of egg products from the U.S., valued at $49.9 million. With the conclusion of a bilateral trade agreement, the U.S. is no longer at a competitive disadvantage with respect to the E.U.

Mexico fell to the 2nd rank of importers from the U.S. during January-February 2024 based on a volume of 1,032 metric tons with a value of $3.7 million, representing 22.5 percent of volume and 16.5 percent of the total value of U.S. exports of egg products. Exports to Mexico were up by 10.3 percent in volume but 30.2 percent lower in value compared to January-February 2023. The unit value of $3,585 per metric ton can be compared with the average unit value for U.S. exports of all egg products at $4,879 per metric ton.
Canada was the 3rd-ranked importer in January-February 2024 based on a volume of 744 metric tons with a value of $2.7 million. Canada represented 15.2 percent of volume and 12.1 percent of value with a unit price of $3,629 per metric ton. During February Canada was 2nd- ranked with 503 metric tons representing 20.1 percent of exports of egg products and up 5.4 percent from February 2023. Value was $1.6 million or 14.4 percent of the monthly total, up 128 percent from February 2023 due to a 116 percent increase in unit revenue to $3,180 per metric ton, reflecting a change in proportions of egg products consigned. Volumes shipped reflect restoration of the institutional and food service sectors and relative availability of domestic product in Canada.
South Korea was ranked fourth among importers of egg products during January-February 2024 with a volume of 635 metric tons valued at $2.5 million with a unit value of $3,937 per metric ton. Comparing these values with January-February 2023, volume was 177 percent higher and value was up by 92.3 percent. Most flocks in South Korea have been restored to production after depopulation following 2021-2022 outbreaks of HPAI. Import volume may have been influenced by limited but rising flock depletion or alternatively increased demand in advance of the Lunar New Year. In 2023 South Korea imported 1,141 metric tons valued at $5.3 million. Depending on severity, the return of HPAI may result in a disparity between local availability and demand requiring imports in 2024 as in 2022.
COMMENTS
Exports to Canada and Mexico combined in 2022 amounted to $126.5 million in value equivalent to 47.5 percent of the total value of shell eggs and products shipped. During 2023 exports valued at $150.7 million represented 50.8 percent of shell egg and egg products amounting to $296.5 million. Canada represented 59.0 percent of the $162.2 million for shell eggs and 10.3 percent of egg products valued at $121.2 million, consigned during 2023, emphasizing dependence on this USMCA partner. During January-February 2024 the USMCA represented 49.0 percent of combined shell egg and product sales valued at $46.5 million.
Aspirational volumes of exports in excess of five percent of domestic production are unrealistic. The E.U., Japan, South Korea and Taiwan will buy according to their needs for undifferentiated shell eggs and products based on landed price in a competitive World market. Purchase decisions for commodities are determined by FOB price, freight, duty and broker margins. Shell eggs and the various categories of egg products are essentially commodities and generally do not respond to promotion.
Exports will be dependent on the willingness of importers to accept the World Organization for Animal Health (WOAH) principle of regionalization (zoning) in the event of outbreaks of exotic Newcastle disease or isolation of either H5 or H7 avian influenza (AI), in commercial flocks, irrespective of pathogenicity. Most importing nations are now applying regionalization and permitting imports on a zonal, county or state-exclusion basis following H5 or H7 AI infection. Canada and the U.S. operate according to a 2018 bilateral agreement to maintain trade in the event of outbreaks of catastrophic exotic diseases including HPAI and END.
Generally pasteurized egg products should not be subject to any embargo imposed following reports of AI or Newcastle disease in a region.
|
USDA Data On Cage-Free Production For March 2024
|
04/01/2024 |
|
EGG-NEWS summarizes and comments on data and trends in the monthly USDA Cage-Free Report. This data is correlated and interpreted in the WeeklyEggPrice and Inventory Report posted on EGG-NEWS mailed on Fridays each week.
 The USDA Cage-Free Report covering March 2024, released on April 1st 2024, documented the complement of hens producing under the Certified Organic Program to be 18.2 million (rounded to 0.1 million), down 0.5 percent from February 2024. The number of hens classified as cage-free (but excluding Certified Organic) and comprising aviary, barn and other systems of housing apparently declined by less than 0.1 percent from February 2024 to an unaltered 106.5 million. Hen numbers posted by the USDA over the 4th quarter of 2023 and especially February 2024 are questioned based on the stated average hen-week production. The number of eggs collected is accepted as accurate but since the value for average weekly production is unacceptably high the denominator reflecting number of hens is probably incorrect. Alternatively if conventional eggs from cages are deceptively marketed as cage-free, assuming an accurate number of hens over a given month, the apparent hen-week value would be incorrectly high. Since the inception of the Cage-Free Report monthly figures have shown erratic fluctuation as during the 1st Quarter of 2024 or alternatively are unchanged in consecutive months. Actual production of eggs is based on the reality of a continuing cycle of placing a predicted number of pullets and depletion of old hens but with limited application of molting for cage-free flocks. The respective numbers of hens claimed for organic and cage-free flocks should reflect chick placements, HPAI depopulation and age-related depletion and should correspond to monthly supply data and inventory extending over successive quarters. The USDA Cage-Free Report covering March 2024, released on April 1st 2024, documented the complement of hens producing under the Certified Organic Program to be 18.2 million (rounded to 0.1 million), down 0.5 percent from February 2024. The number of hens classified as cage-free (but excluding Certified Organic) and comprising aviary, barn and other systems of housing apparently declined by less than 0.1 percent from February 2024 to an unaltered 106.5 million. Hen numbers posted by the USDA over the 4th quarter of 2023 and especially February 2024 are questioned based on the stated average hen-week production. The number of eggs collected is accepted as accurate but since the value for average weekly production is unacceptably high the denominator reflecting number of hens is probably incorrect. Alternatively if conventional eggs from cages are deceptively marketed as cage-free, assuming an accurate number of hens over a given month, the apparent hen-week value would be incorrectly high. Since the inception of the Cage-Free Report monthly figures have shown erratic fluctuation as during the 1st Quarter of 2024 or alternatively are unchanged in consecutive months. Actual production of eggs is based on the reality of a continuing cycle of placing a predicted number of pullets and depletion of old hens but with limited application of molting for cage-free flocks. The respective numbers of hens claimed for organic and cage-free flocks should reflect chick placements, HPAI depopulation and age-related depletion and should correspond to monthly supply data and inventory extending over successive quarters.
Average weekly production for Certified Organic eggs in March 2024 was down 1.0 percent compared to February 2024 with a questionable average weekly production of 83.8 percent. Down from 84.2 percent in February. Average weekly flock production for cage-free flocks other than Certified Organic was down 0.5 percent in March 2024, also with a questionably high average hen month production of 82.6 percent down from 83.0 percent. Seasonally, younger flocks increase the availability of cage-free and organic eggs in response to pullet chick placements laid down 22 weeks previously in anticipation of peak seasonal demand periods. March 2024 data may have reflected a presumed higher proportion of younger flocks derived from pullet chicks placed during late August and early September 2023 in anticipation of Easter 2024 demand. Since the proportion of pullets according to housing type is not indicated in the monthly USDA Chickens and Eggs report it is not possible to assess the relative sizes of flocks producing under the certified organic label or for other categories. There is no adequate explanation for the high production rate especially if the stated number of hens is lower than actual, especially with undercounted HPAI flock depopulation that appears to be the case at present. This raises the question of possible illegal diversion of caged eggs into the cage-free or organic streams.
|
Flock Size Average
(million hens)
|
March
2024
|
Average
Q1-
2024
|
Average
Q4- 2023
|
Average
Q3 –
2023
|
Average
Q2 –
2023
|
Average
Q1 –
2023
|
|
Certified Organic
|
18.3
|
18.3
|
18.7
|
18.7
|
18.2
|
17.3
|
|
Cage-Free Hens
|
106.5
|
105.7
|
106.4
|
105.4
|
103.2
|
98.1
|
|
Total Non-Caged
|
124.8
|
124.0
|
125.1
|
124.1
|
121.4
|
115.4
|
|
Average Weekly Production (cases)
|
February
2024
|
March
2024
|
|
Certified Organic @ 83.8% hen/day
|
300,309
|
297,225 -1.0%
|
|
Cage-Free @ 82.6% hen/day
|
1,719,872
|
1,711,190 -0.5%
|
|
Total Non-Caged @ 82.8% hen/day
|
2,020,181
|
2,008,415 -0.6%
|
|
Average Nest Run Contract Price Cage-Free Brown
|
$1.68/doz. (Unchanged since September 2023)
|
|
March 2024 Range:
|
$1.35 to $2.35/doz. (unchanged since March 2023)
|
|
FOB Negotiated March price, grade-ready quality, loose nest-run. Price range $2.00 to $2.85 per dozen
|
Average March 2024 Value of $2.50/doz.
($2.60/doz. February 2024)
|
|
Average March Advertised National Retail Price C-F, Large Brown
|
$3.28/doz. March 2024 (4 regions)
(was $3.37 in February 2024)
|
|
USDA Based on 4 Regions, 2,900 stores
Excluding SW, NW, AK and HI.
|
High: $3.44/doz. (SC. 629 stores)
Low: $2.95/doz. (MW. 816 stores)
|
Negotiated nest-run grade-ready cage-free price for March 2024 averaged $2.50 per dozen, down by 6.0 percent from $2.66 per dozen in February 2024, reflecting lower demand relative to supply. The March 2024 advertised U.S. retail price for cage-free eggs over four regions (excluding SW. NW. AK. and HI.) was $3.28 per dozen down 9 cents per dozen from February 2024 over 2,900 stores.
The apparent difference between a recorded average wholesale price of $2.50 per dozen plus a provision of 60 cents per dozen for packaging, packing and transport in relation to the average four-region retail price of $3.28 corresponds to an average retail margin of 5.5 percent (3.4 percent last month) over the average wholesale price for packed eggs delivered to a DC. at $3.11 per dozen. Margins are presumed higher for pastured and other specialty eggs at shelf prices reaching $9.00 per dozen. Chains that are maximizing margins especially on Certified Organic, free-range and pastured categories restrict the volume of sales, ultimately disadvantageous to producers.
Based on the importance of cage-free production, the USDA-AMS issue the Cage-Free report on volumes and prices at monthly intervals for the information of Industry stakeholders. There is obvious doubt as to the accuracy of individual monthly flock numbers especially when reports show a marked change at the end of a quarter or from the previous month without obvious cause, or alternatively when there is no change in the cage-free flock for sequential months.
 According to APHIS data approximately 13 million hens were depopulated during the 4th quarter of 2023 as a result of HPAI. The UEP reported that 47 percent of depopulations have involved cage-free flocks. The approximately 6 million cage-free hens apparently depopulated are not adequately reflected in the recent monthly cage-free reports. The USDA should provide an explanation and appropriate corrections. According to APHIS data approximately 13 million hens were depopulated during the 4th quarter of 2023 as a result of HPAI. The UEP reported that 47 percent of depopulations have involved cage-free flocks. The approximately 6 million cage-free hens apparently depopulated are not adequately reflected in the recent monthly cage-free reports. The USDA should provide an explanation and appropriate corrections.
It is suggested that USDA should consider a quarterly report with more accurate hen data. This would be more useful to the industry for planning and marketing decisions. Price data is available each week from other USDA reports.
Subscribers are referred to weekly USDA wholesale and retail prices posted in the Egg Price and Inventory Report in EGG-NEWS E-mailed each Friday. The previous Monthly Cage-Free Report is available under the STATISTICS Tab.
|
Egg Projection
|
03/15/2024 |
|
Updated March 2024 USDA Projection for U.S. Egg Production and Consumption.
 On March 14th 2024 the USDA Economic Research Service issued updated values for egg production during 2022 with a projection for 2023 and a forecast for 2024. Production, consumption and prices were only slightly revised from the previous February 14th 2024 report. On March 14th 2024 the USDA Economic Research Service issued updated values for egg production during 2022 with a projection for 2023 and a forecast for 2024. Production, consumption and prices were only slightly revised from the previous February 14th 2024 report.
Projected egg production for 2023 was reduced by 23 million dozen from the February 2024 Report to 7,864 million dozen This will be 0.5 percent higher than in 2022 due to progressive replacement of the 44 million hens depleted due to HPAI over the period extending from early spring through mid-December 2022. The per capita consumption of shell eggs and liquids combined for 2023 will be 0.6 percent lower than in the February report to 279.3 eggs but up two eggs (0.7 percent) from 2022. The projected average 2023 benchmark New York bulk unit price was unchanged from the February report at 192 cents per dozen. This was 31.9 percent lower than in 2022 attributed to a comparison with unseasonal high prices from the end of March through the 2nd Quarter of 2023.
Subsequent USDA projections will provide greater clarity on the recovery in consumption in an economy that is undergoing deflation. The 2023 Midwest in-carton wholesale price peaked at $5.17 per dozen on January 3rd 2023 but fell precipitously to a market bottom of $0.78 per dozen on May 8th 2023. Price was restored in February 2024 but settled to $2.34 on March 8th 2024. This was above the USDA/EIC projection of the combined nest-run February 2023 cost of 76.0 cents per dozen for caged white Large, plus a provision for processing, packaging and transport of 60 cents per dozen amounting to $1.36 cents per dozen delivered to a distribution center.
Restoration in flock size after HPAI flock depletions in 2022 progressed at a rate of approximately 0.5 million per week but was limited by the availability of pullet chicks for replacement and in some companies the rate of conversion to alternative housing systems. Restoration of the national flock was compromised by a resurgence of HPAI with 13.0 million layers depleted during the 4th quarter of 2023 representing 4.0 percent of the nominal producing flock of 325 million hens, mainly on complexes averaging over one million hens. The cost of ingredients will influence margins and may result in cessation of production by some small-scale producers that run out of working capital since financial losses were incurred through summer up to mid-fall. Unpredictable factors affecting price will include the extent of losses during the spring of 2024 due to a predicted reemergence of avian influenza; the supply and cost of ingredients as influenced by world and national availability and the intensity and persistence of domestic consumer demand. Exports of eggs and products at approximately two percent of total production will not materially affect the domestic price.
 The forecast for 2024 includes production of 7,990 million dozen, up 1.6 percent from 2023. Consumption will attain 283.3 per capita, up an optimistic four eggs or 1.4 percent above the projection for 2023. This will naturally depress prices with the NY-Large price dropping by 12 cents per dozen or 6.3 percent from the average for 2023. The forecast for 2024 includes production of 7,990 million dozen, up 1.6 percent from 2023. Consumption will attain 283.3 per capita, up an optimistic four eggs or 1.4 percent above the projection for 2023. This will naturally depress prices with the NY-Large price dropping by 12 cents per dozen or 6.3 percent from the average for 2023.
In 2023 egg exports as shell and products combined attained 5,161 million dozen shell-equivalents, or 2.2 percent of production. During 2022 egg imports as a result of HPAI depopulation, some in shell form but predominantly products, attained 25.9 million dozen shell-equivalents, up 42.8 percent from 14.9 million dozen and 26.4 percent from 2021.
During 2023 shell egg exports attained 89.4 million dozen, up 28.6 percent compared to 2022 when high domestic prices prevailed. Egg products were up 18.2 percent to 20,814 metric tons compared to 2022.
March 2024 USDA data is shown in the table below:-
|
Parameter
|
2020
(actual)
|
2021
(actual)
|
2022
(actual)
HPAI
|
2023
(projection)
|
2024
(forecast)
|
% Difference
2023-2024
|
|
Production (million dozen)
|
8,070
|
8,031
|
7,825
|
7,864
|
7,990
|
+1.6
|
|
Consumption (eggs per capita)
|
279.0
|
282.5
|
280.5
|
279.3
|
283.3
|
+1.4
|
|
New York price c/doz.)
|
112
|
119
|
282
|
192
|
180
|
-6.3
|
Source: Livestock, Dairy and Poultry Outlook released March 14th 2024
Subscribers to EGG-NEWS are referred to the postings depicting weekly prices, volumes and trends and the monthly review of prices, exports and related industry statistics.
|
USDA Agricultural Prices Report
|
11/17/2023 |
|
 THE USDA Agricultural Prices Report released October 31st posted September prices for agricultural commodities and expenditures. THE USDA Agricultural Prices Report released October 31st posted September prices for agricultural commodities and expenditures.
September Prices Received Index, down 2.9 percent from August
The USDA ERS summarized prices as follows:-“The September Prices Received Index 2011 Base (Agricultural Production), at 122.6, decreased 2.9 percent from August and 7.1 percent from September 2022. At 113.9, the Crop Production Index was down 4.2 percent from last month and 11 percent from the previous year. The Livestock Production Index, at 133.1, decreased 0.9 percent from August, and 2.6 percent from September last year. Producers received lower prices for corn, hogs, soybeans, and lettuce during September, but higher prices for broilers, milk, grapes, and broccoli. In addition to prices, the volume change of commodities marketed also influences the indexes. In September, there was decreased marketing of cattle, wheat, cotton, and peaches and increased monthly movement for soybeans, corn, dry beans, and apples”.

September Prices Paid Index, Up 0.1 Percent from August
“The September Prices Paid Index for Commodities and Services, Interest, Taxes, and Farm Wage Rates (PPITW), at 138.8, is up 0.1 percent from August 2023 but unchanged from September 2022. Higher prices in September for feeder cattle, feeder pigs, diesel, and nitrogen more than offset lower prices for feed grains, complete feeds, concentrates, and hay & forages”.
Corn farmers received $5.21 per bushel in September 2023 compared to $5.73 per bushel in August 2023, down 9.1 percent. The price received in September 2022 was $7.09 per bushel
Soybean farmers received $13.20 per bushel in September 2023 compared to $14.10 per bushel in August 2023, down 6.8 percent. The price received in September 2022 was $14.20 per bushel
The September 2023 egg price received by farmers was $ 1.22 per dozen for table eggs lower than $1.35 per dozen in August 2023 and compared to $2.65 per dozen in September 2022. The sharp year-on-year increase is attributed to disequilibrium between supply and demand. Highly pathogenic avian influenza resulted in depletion of 44 million hens with a reduction of 20 million producing birds in the supply flock on average from mid 2022 onwards. This situation was coupled with increased demand as consumers increased purchases of eggs representing a competitively priced protein source in an inflationary environment.
|
Planted Acreage Report
|
06/30/2023 |
|
The June 30th 2023 Planted Acreage report documented the respective areas planted to corn and soybeans, the two commodities of relevance to the poultry industry. The USDA confirmed:-
Corn-planted area for all purposes in 2023 is estimated at 94.1 million acres, up six percent or 5.52 million acres from last year. This represents the third highest planted acreage in the United States since 1944. Compared with last year, planted acreage is expected to be up or unchanged in 43 of the 48 estimating States. Area harvested for grain, at 86.3 million acres, is up nine percent from last year.
Soybean-planted area for 2023 is estimated at 83.5 million acres, down five percent from last year. Compared with last year, planted acreage is down or unchanged in 21 of the 29 estimating States.
Together with the Grain Stocks report the Planted Acreage data moved the market for corn and soybeans by about five percent but in contrasting directions.
For corn the acreage was above the most optimistic projection although offset by a lower stock. At 14H30 on the CME after the release of the two USDA reports, corn was down 25 cents per bushel to 556 cents for July delivery and for September, corn was down 34 cents per bushel to 489 cents.
For soybeans the reduced acreage and consequently lower ending stocks was bullish for the new crop. At 14H30 CME soybeans were up 75 cents per bushel to 1,558 cents for July delivery and for September the soybean price was up 73 cents per bushel to 1,354 cents.
|
USDA-ERS Predicts Egg Prices for 2023
|
02/27/2023 |
|
 According to USDA economists, retail egg prices increased by 8.5 percent in January 2023, approximately 70.1 percent above January 2022. The USDA-ERS now predicts that egg prices will increase by 37.8 percent in 2023 but with a wide range of 18.3 to 62.3 percent attributed to volatility. Concurrently the USDA-ERS predicted a 4.7 percent increase in the p According to USDA economists, retail egg prices increased by 8.5 percent in January 2023, approximately 70.1 percent above January 2022. The USDA-ERS now predicts that egg prices will increase by 37.8 percent in 2023 but with a wide range of 18.3 to 62.3 percent attributed to volatility. Concurrently the USDA-ERS predicted a 4.7 percent increase in the p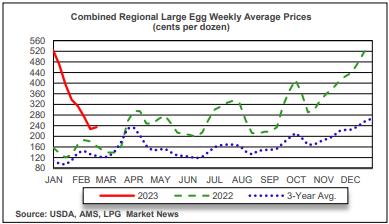 rice of meats, 7.2 percent for dairy products and 12.8 percent for cereals and bakery products. rice of meats, 7.2 percent for dairy products and 12.8 percent for cereals and bakery products.
Wholesale farm-level egg prices are predicted to increase by 7.4 percent in 2023 with a wide prediction interval of -32.6 to 76.1 percent. Egg prices are extremely volatile, complicating reliable predictions.
EGG-NEWS will monitor weekly USDA wholesale prices by region and average retail prices to document retail margins.
|
|
|
Top
|
|