REVIEW OF FEBRUARY 2024 EGG PRODUCTION COSTS AND STATISTICS
Commencing in 2024 the EIC has justifiably separated the production costs and unit revenue values for eggs derived from caged and cage-free flocks. Accordingly EGG-NEWS will continue to summarize data but will consolidate production and export statistics for the U.S. egg industry and compare financial data for the two shell-egg categories.
FEBRUARY HIGHLIGHTS
- February 2024 USDA ex-farm blended USDA nest-run, benchmark price for conventional eggs from caged hens was 251 cents per dozen, up 45.9 percent from the January 2024 value of 172 cents per dozen. For comparison, average monthly USDA benchmark price over 2023 was 146.0 cents per dozen with a range of 323 cents per dozen in January down to a low of 57 cents in May. Stock levels and prices prior to the onset of flock depletions due to HPAI indicated a relative seasonal balance between supply and demand. Future nest-run and wholesale prices will be largely dependent on consumer demand for eggs and liquid and the rate of replacement of pullets and hens depleted due to HPAI. Other considerations include diversion to shell sales from the egg-breaking sector in an interconnected industry.
- Fluctuation in wholesale price is attributed in part to the amplification of upward and downward swings associated with the commercial benchmark price discovery system in use. Restoration of seasonal prices commenced midway through the fourth quarter of 2023 with a plateau after Christmas followed by a seasonal decline through January 2024. A substantial rise in price occurred during early through late February but with a sharp decline thereafter to mid-March. An unknown factor in future pricing will be the incidence rate and severity of highly pathogenic avian influenza in spring months with northward migration of waterfowl. Close to 13 million hens and 2.5 million pullets were depopulated during the fourth quarter of 2023 among five states with heavy losses in California.
- February 2024 USDA average nest-run production cost for generic eggs from caged flocks over four regions (excluding SW and West), applying updated inputs was down 1.6 cents per dozen to 76.0 cents per dozen compared to the January 2024 value of 77.6 cents per dozen, mainly attributable to a 4 percent lower average feed cost per dozen. Approximately 60 cents per dozen should be added to the USDA benchmark nest-run cost to cover processing, packing material and transport to establish a realistic price as delivered to warehouses.
- February 2024 USDA benchmark nest-run margin attained a positive value of 175.0 cents per dozen for generic eggs from caged flocks compared to a positive margin of 94.4 cents per dozen for January 2024. Average nest-run monthly margin over 2023 was 64.2 cents per dozen compared to 155 cents per dozen in 2022. This differential was mainly due to higher prices following HPAI-depletion of flocks. It is emphasized that the U.S. benchmark price reflects nest-run conventional eggs.
- The February 2024 national flock in production (over 30,000 hens per farm) was stated by the USDA to be up 0.1 million hens (rounded) to 300.0 compared to the revised January 2024 value of 299.7 million. This figure apparently takes into account depletion of 4.2 million hens during December 2023 that were not recorded in the month. Approximately 3.0 million hens returned to production from molt in February together with projected maturation of 22.0 million pullets, with this number offset by depletion of spent flocks. During the fourth quarter of 2023 approximately 13 million hens and 2.5 million pullets were depopulated due to HPAI in five states.
- January 2024 pullet chick hatch of 26.1 million was up 8.6 percent or 2.1 million chicks from December 2023.
- January 2024 exports of shell eggs and products combined was down 34.8 percent from December 2023 to 394,000 case equivalents representing the theoretical production of 5.2 million hens. The decrease was attributed to depressed demand for shell eggs by importing countries.
TABLES SHOWING KEY PARAMETERS FOR FEBRUARY 2024.
Summary tables for the latest USDA February 2024 flock statistics, costs and unit prices made available by the EIC on March 13th 2024 are arranged, summarized, tabulated and compared with values from the previous February 16th 2024 posting reflecting January 2024 costs and production data as applicable. Monthly comparisons of production data and costs are based on revised USDA values.
VOLUMES OF PRODUCTION REFECTING THE ENTIRE INDUSTRY
|
PARAMETER
|
January 2024
|
February 2024
|
|
Table-strain eggs in incubators
|
49.1* million (Jan.)
|
59.1 million (Feb.)
|
|
Pullet chicks hatched
|
24.2 million (Dec.)
|
26.1 million (Jan.)
|
|
Pullets to be housed 5 months after hatch
|
21.8 million (May.)
|
22.8 million (June)
|
|
EIC 2023 December 1st Flock Projection (estimate)
|
328.9 (Jan.)
|
328.0 million (Feb.)
|
|
National Flock in farms over 30,000
|
299.7million (Dec.)
|
300.0 million (Jan.)
|
|
National egg-producing flock
|
315.7* million (Dec.)
|
310.4 million (Jan.)
|
|
Cage-free flock excluding organic
|
103.9* million (Jan.)
|
106.5 million (Feb.)
|
|
Proportion of flocks in molt or post-molt
|
11.5% (Jan.)
|
11.2% (Feb.)
|
|
Total of hens in National flock, 1st cycle (estimate)
|
279.4 million (Dec.)
|
275.6 million (Jan.)
|
|
Total U.S. Eggs produced (billion)
|
8.143* December 2023
|
7.98 January 2024
|
|
Total Cage-Free hens in production
|
122.3 million (Jan.)
15.0*% Organic
|
124.8 million (Feb.)
14.7% Organic
|
|
“Top-5” States hen population (USDA)1
|
147.9 million (Dec.)
|
148.5 million (Jan.)
|
* Revised USDA/EIC
Notes 1. Texas excluded to maintain confidentiality
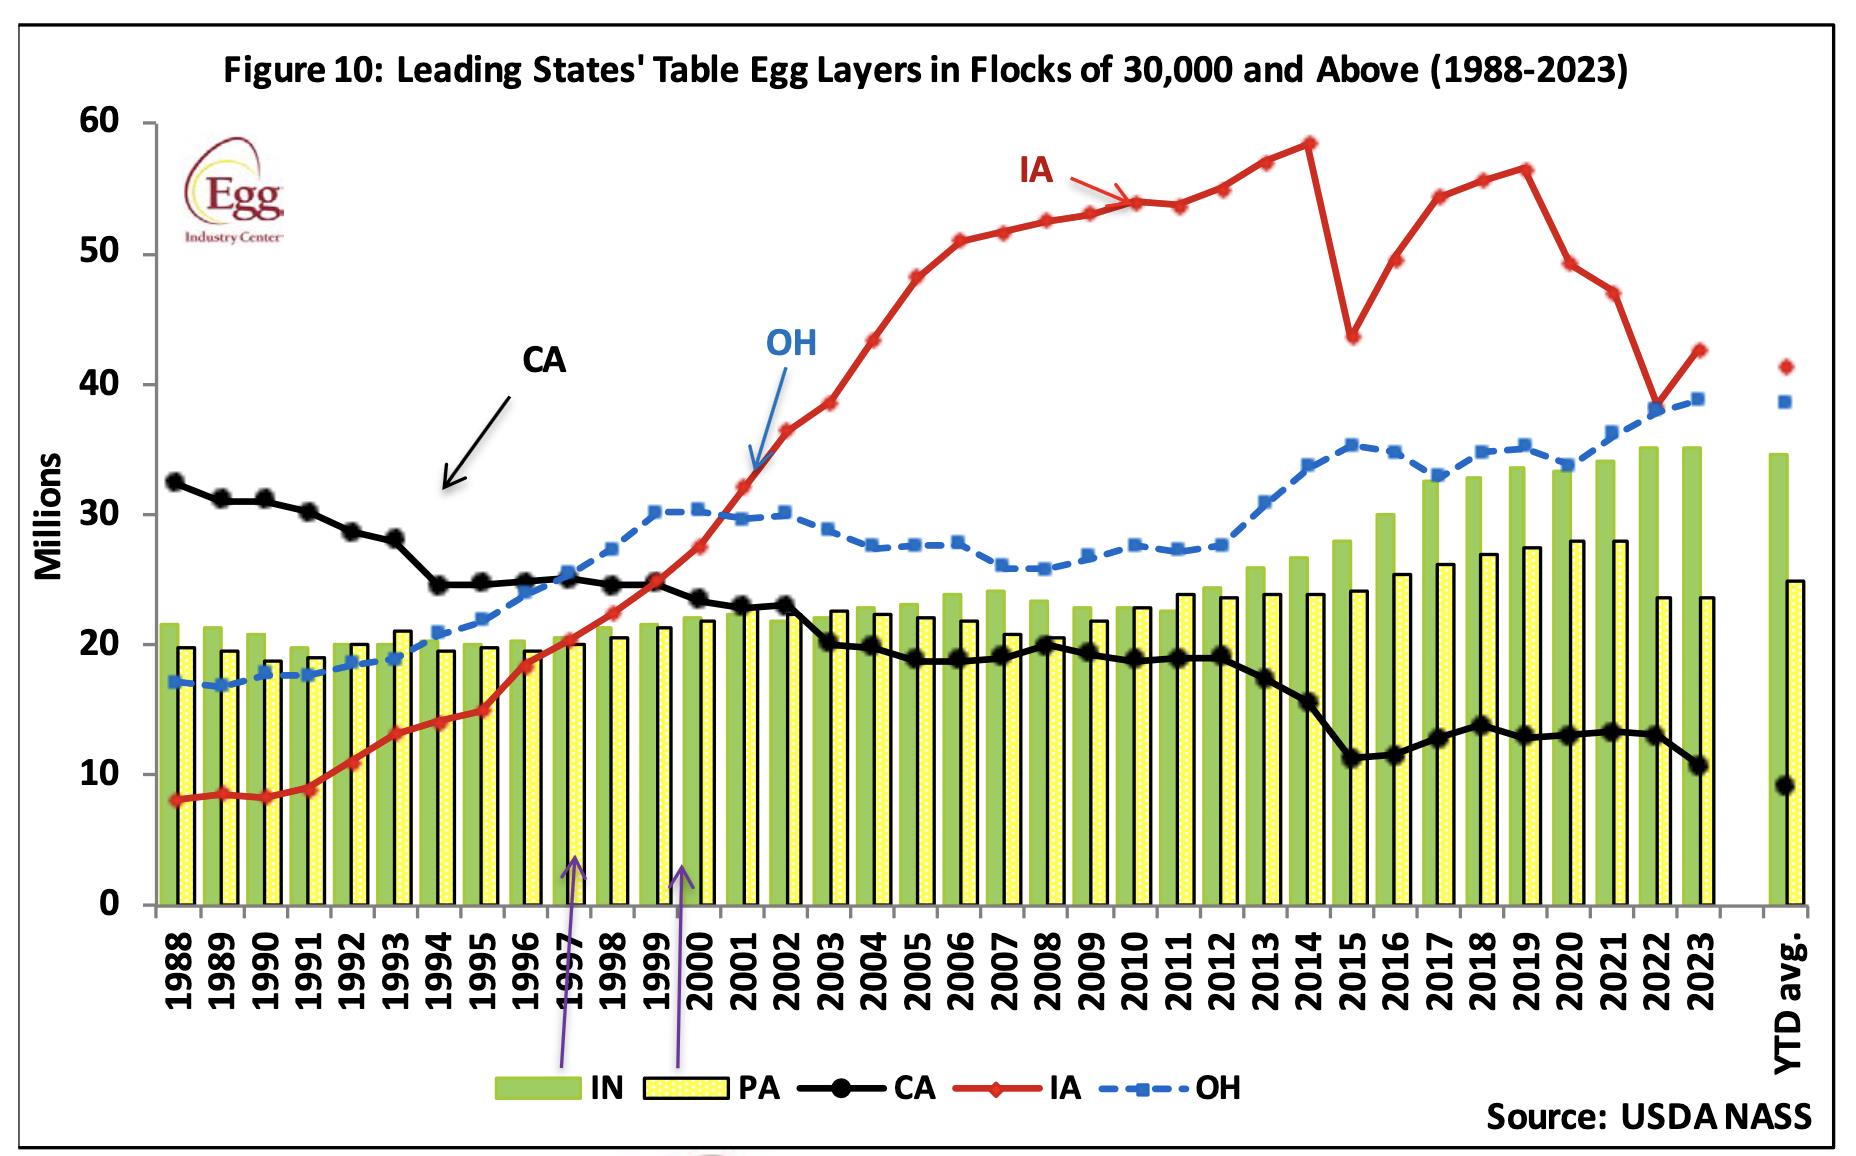
PROPORTION OF U.S. TOTAL HENS BY STATE, 2023/20241
Based on a nominal denominator of 300 million hens in flocks over 30,000 covering 94.6 percent of the U.S complement.
USDA has amended inclusion of specific states in regions and eliminated Texas data to protect confidentiality of Company flock
Sizes
|
STATE
|
DECEMBER *
2023
|
JANUARY*
2023
|
|
|
Iowa
|
14.3%
|
13.8%
|
|
|
Indiana
|
11.8%
|
11.6%
|
|
|
Ohio
|
12.6%
|
12.9%
|
|
|
Pennsylvania
|
8.0%
|
8.3%
|
|
|
Texas (estimate)
|
7.5% ?
|
7.5%?
|
|
|
California
|
3.0%
|
3.0%?
|
|
- Values rounded to 0.1%
*USDA data is questioned based on known values for hen depopulation and pullet placements with discrepancies in stated values during the 4th quarter of 2023
Rate of Lay, weighted hen-week (USDA) 83.3% January 2024. 82.6% February 2024
Revised per capita egg consumption 2020:- 285.6 (down 7.8 eggs from 2019)*
Revised per capita egg consumption 2021:- 282.5 (down 3.1 eggs from 2020)*
Revised per capita egg consumption 2022:- 279.0 (down 3.5 eggs from 2021 due to HPAI) Projected per capita egg consumption 2023:- 280.9 (up 1.9 eggs from 2022) Forecast per capita egg consumption 2024 283.7 (up 2.8 eggs from 2023 accepting HPAI losses)
*Revised, using data from USDA Livestock, Dairy and Poultry Outlook February 14th 2023 taking into account demand from the food service sector and presumably including the effect of HPAI depopulation.
Egg Inventories at beginning of February 2024:
Shell Eggs: 1.51 million cases down 17.5 percent from January 2024.
Frozen Egg Products: 757,238 case equivalents down 15.7 percent from January 2024
Dried Egg Products: Not disclosed since March 2020 following market disruption due to
COVID. Moderate level of inventory are assumed
Eggs broken under FSIS inspection (million cases)
January 2024, 6.37 DECEMBER 2023, 6.31
Cumulative eggs broken under FSIS inspection 2023 (million cases) 78.7 JAN. to DEC.
Cumulative 2023: number of cases produced (million) 262.9 JAN. to DEC.
Cumulative 2023: proportion of total eggs broken 29.9% (30.8% 2022)
Cumulative eggs broken under FSIS inspection 2024 (million cases) 6.37 JAN.
Cumulative 2024: number of cases produced (million) 22.17 JAN.
Cumulative 2024: proportion of total eggs 28.8 JAN.
EXPORTS JANUARY 2024: (Expressed as shell-equivalent cases of 360 eggs).
|
Parameter
|
Quantity Exported
|
|
Exports:
|
2023 2024
|
|
Shell Eggs (thousand cases)
|
Dec. 250 Jan. 132
|
|
Products (thousand case equivalents)
|
Dec. 355 Jan. 262
|
|
TOTAL (thousand case equivalents)*
|
Dec. 605 Jan. 394
|
*Representing 1.2 percent of National production in January 2024 (2.7 percent December 2023).
COSTS AND UNIT REVENUE VALUES1 FOR CONVENTIONAL EGGS FROM CAGED HENS
|
Parameter
|
JANUARY 2024
|
FEBRUARY 2024
|
|
5-Region Cost of Production ex farm (1st Cycle)
|
77.6* c/doz
|
76.0 c/doz
|
|
Low
|
75.7*c/doz (MW)
|
74.1 c/doz (MW)
|
|
High
|
79.1 c/doz (NE)
|
77.4c/doz (NE)
|
Notes: *Revised EIC
1. Excludes SW and West
Components of Production cost per dozen:-
|
|
JANUARY 2024
|
FEBRUARY 2024
|
|
Feed
|
37.7* c/doz
|
36.2c/doz
|
|
Pullet depreciation
|
12.0 c/doz
|
11.9 c/doz
|
|
Labor (estimate) plus
|
|
|
|
Housing (estimate) plus
|
27.9c/doz1
|
26.9c/doz
|
|
Miscellaneous and other (adjusted May 2023)
|
|
|
Ex Farm Margin (rounded to nearest cent) according to USDA values reflecting FEBRUARY 2024:-
251.0 cents per dozen1- 76.0 cents per dozen = 175.0 cents per dozen (January 2024 comparison: 172.0 cents per dozen – 77.6* cents per dozen = 94.4 cents per dozen.
Note 1: USDA Blended nest-run egg price
* Revised EIC
|
|
|
January 2023
|
FEBRUARY 2024
|
|
USDA
|
Ex-farm Price (Large, White)
|
172.0 c/doz (Jan.)
|
251.0c/doz (Feb.)
|
|
|
Warehouse/Dist. Center
|
213.8 c/doz (Jan.)
|
310.0c/doz (Feb.)
|
|
|
Store delivered (estimate)
|
218.8 c/doz (Jan.)
|
315.0 c/doz (Feb.)
|
|
|
Dept. Commerce Retail National
|
251.0 c/doz (Dec.)
|
252.0 c/doz (Jan.)
|
|
|
Dept. Commerce Retail Midwest
|
239.0 c/doz (Dec.)
|
234.0 c/doz (Jan.)
|
MONTH January 2024 FEBRUARY 2024
U.S. Average Feed Cost per ton $244.35* $236.15
Low Cost Midwest $222.54* $213.47
High Cost West $289.06* $284.09
Differential $ 66.52 $ 70.62
Pullet Cost
(19 Weeks) $4.70* JANUARY 2024 $4.63 FEBRUARY 2024
(16 weeks) $4.13* JANUARY 2024 $4.07 FEBRUARY 2024
* Values adjusted by EIC
COSTS AND UNIT REVENUE FOR EGGS FROM CAGE-FREE HENS
|
Parameter
|
JANUARY 2024
|
FEBRUARY 2024
|
|
5-Region Cost of Production ex farm (1st Cycle)
|
96.5* c/doz
|
95.8 c/doz
|
|
Low
|
93.1*c/doz (MW)
|
91.3 c/doz
|
|
High
|
106.4* c/doz (West)
|
105.4 c/doz
|
*Revised EIC
Components of Production cost of cage-free eggs per dozen:-
|
|
JANUARY 2024
|
FEBRUARY 2024
|
|
Feed
|
43.7* c/doz
|
42.3 c/doz
|
|
Pullet depreciation
|
15.9* c/doz
|
15.4 c/doz
|
|
Labor (estimate) plus
|
|
|
|
Housing (estimate) plus
|
36.9*c/doz
|
38.1 c/doz
|
|
Miscellaneous and other
|
|
|
* Revised EIC
Ex Farm Margin (rounded to nearest cent) according to USDA values reflecting February 2024:-
Cage-Free brown 266 cents per dozen1- 95.8 cents per dozen = 170.2 cents per dozen
January 2024 300 cents per dozen - 96.5 cents per dozen = 203.5 cents per dozen
|
|
|
JANUARY 2024
|
FEBRUARY 2024
|
|
USDA
|
Average Ex-farm Price1
|
168 c/doz (Jan.)
|
168 c/doz (Feb.)
|
|
|
Warehouse/Dist. Center
|
300 c/doz (Jan.)
|
266 c/doz (Feb.)
|
|
|
Store delivered (estimate)
|
305 c/doz (Jan.)
|
271 c/doz (Feb.)
|
|
|
Dept. Com. Retail C-F Brown
Dept. Com. Retail C-F White
|
336 c/doz (Jan.)
322 c/doz (Jan.)
|
331 c/doz (Feb.)
295 c/doz (Feb.)
|
|
|
Dept. Com. Retail Organic
Dept. Com. Retail Pasture
|
522 c/doz (Jan.)
1,051 c/doz (Jan.)
|
462 c/doz (Feb.) 1,055 c/doz(Feb.)
|
1. Contract price, nest-run loose Range 135 to 235 c/doz. Negotiated average 266 c/doz.
Cage-Free Pullet Cost
(19 Weeks) $5.70* JANUARY $5.63 FEBRUARY 2024
(16 weeks) $4.97* JANUARY $4.92 FEBRUARY 2024
Feed Price same as average national and regional values as used for caged flocks. Excludes Organic.
COMMENTARY ON FEBRUARY 2024 STATISTICS AND COSTS
The USDA reports data for five regions, respectively comprising the Northeast, South East (Mid-Atlantic), South Central, Midwest, and West (NW and California combined or deleted in some tables).
From January 2024 three Pacific Coast states were combined as the West Region. Southwest excluded to maintain confidentiality while providing representative U.S. data. Costs include fixed components (interest, depreciation and overhead) and variable components (feed, pullet depreciation, labor) recalculated in May 2023 by the EIC based on surveys. An adjustment factor reflecting transport was introduced in February 2024. Some USDA data reflecting retail prices, pullet hatch, exports and flock numbers is delayed by a month
\PRODUCTION DATA FOR FEBRUARY 2024 COMBINING CAGED AND CAGE-FREE FLOCKS
- According to USDA, the estimated average complement of U.S. hens in flocks over 30,000 during January 2024 amounted to 300.0 million, reflecting a net 0.3 hen (0.1 percent) increase in flock size during the month. Data for 2024 to date reflect the delayed adjustment for depopulations during the fourth quarter of 2023 not incorporated in weekly USDA reports. Losses and routine depletion were offset by pullet replacements second cycle hens and retained flocks. The average total U.S. flock including hens in molt on all farms counted by the USDA amounted to 310.4 million in January 2024. The average end-of-year flock sizes over the past five years respectively were:- 2019, (341.6 million); 2020, (325.5 million); 2021, (331.6 million); 2022, (310.0 million) and 2023, (311.4 million). The December 1st 2024 flock was projected to be 328.0 million hens during February 2024 applying the EIC model. With replacements, molting and delayed depopulation it is estimated that the national flock now comprises 17 to 20 million fewer hens than before the advent of the H5N1 HPAI epornitic in 2022. In the absence of a vaccine only effective biosecurity will help protect flocks going forward.
- Pullet chick hatch attained 26.1 million in January 2024, up 1.9 million from December 2023. During late January 2024 egg prices rose above the seasonal average possibly influencing demand for chicks together with the need to compensate for depopulated pullet and hen flocks.
- The total in-molt and post-molt population of hens in the 5-Regions monitored by the USDA attained 11.2 percent of the national flock in February 2024, compared to 11.5 Percent for the previous month. Annual averages for molt and post-molt combined were 12.8 percent in 2023; 14.0 percent in 2022 and 14.4 percent in 2021. The historical high value of 23.8 percent in 2016 was due to the loss of hens during the 2015 HPAI epornitic. This situation will not be revisited in 2024.
- During the fourth quarter of 2023 the average monthly transfer of pullets to laying houses was 25.2 million compared to 24.9 million in the third quarter. Revised data anticipate the transfer of 23.1 million pullets per month during the first quarter and 22.2 million in the second quarter of 2024.
- The projected hatchery supply flock (parent generation) peaked at 3.1 million hens in June 2022. The previous high parent-flock of 3.1 million hens in production was in June 2015, coinciding with the end of the HPAI epornitic in that year. Parent hens then declined to a low of 2.5 million during the fourth quarter of 2016. During 2023 the flock size for parent hens averaged 2.4 million over the fourth quarter of 2023 and is projected at 2.5 million during the first and second quarters of 2024. The size of the parent flock is unlikely to be revised based on pullet chick orders influenced by the demand to replace depopulated pullets and hens and in response to possible higher producer margins. It is understood that production of additional pullet chicks is unlikely given forward planning by breeder-hatcheries and full utilization of facilities.
- Average hen-week production of 82.6 percent in February 2024 compares to a value of 83.3 percent in January 2024. This reflects a high proportion of younger hens in the national flock with many first-cycle hens and early second-cycle hens in production. (Alternatively the USDA may be incorrectly counting hens). Average rate of lay in 2023 was 81.8 percent. The average rate of lay during any period is a function of the proportion of pullets placed, the rate of depletion of flocks and retention of molted hens for a second cycle. Average flock production declines as the weighted flock age increases or conversely will rise due to early depletion thereby increasing the proportion of young hens in their first cycle.
- The February 26th edition of the USDA Poultry Slaughter Report documented 5.39 million light spent-hens processed under FSIS inspection during January 2024, 8.7 percent more than the previous month of December 2023 and 7.8 percent more than in January 2023. These differences are inconsequential in comparison to the presumed depletion of 15 million hens per month with most either rendered or consigned to landfills. Provided housing space is available, prevailing low prices will result in depletion of flocks with more routine or previously scheduled flock depletions.
FEBRUARY 2024 COST AND UNIT REVENUE DATA FOR CONVNTIONAL EGGS FROM CAGED FLOCKS.
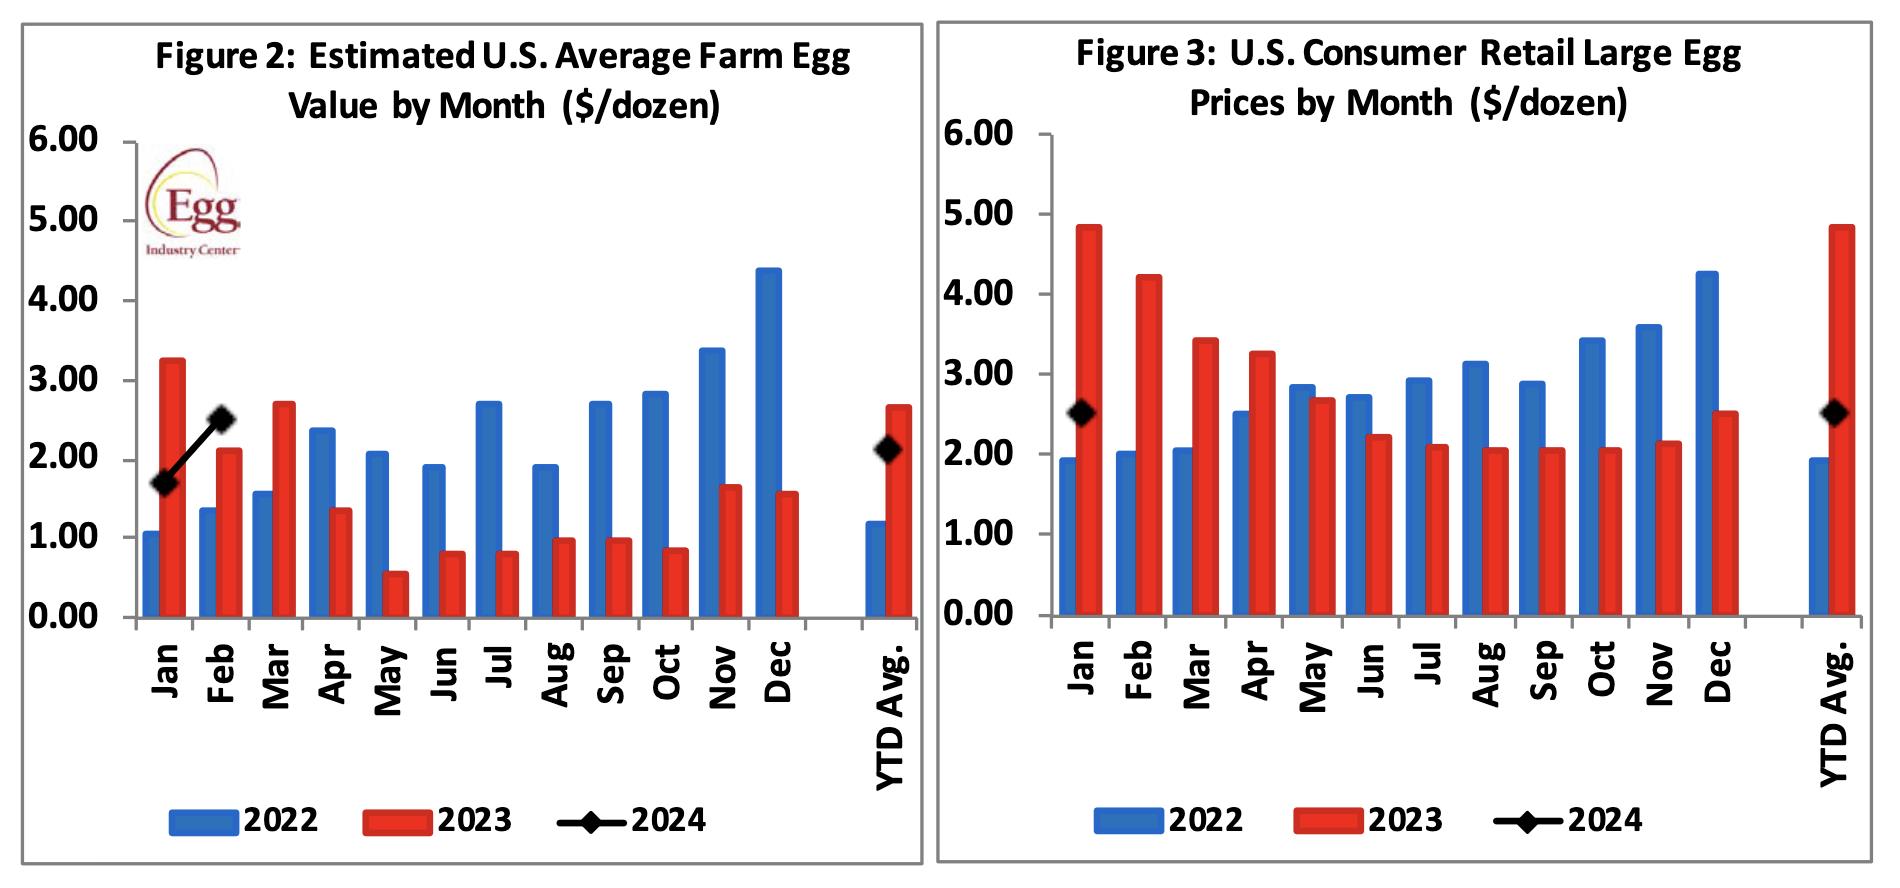
- The USDA ex farm benchmark blended egg price in February 2024 was 45.9 percent higher at 251 cents per dozen from the January 2024 value of 172 cents per dozen. This contributed to a positive margin of 175 cents per dozen based on ‘nest-run’ generic eggs (ungraded as delivered from the laying house) in February 2024, compared to a positive margin of 94.4 cents per dozen in January 2024. The February 2024 USDA benchmark price of 251 cents per dozen should be compared to 211 cents per dozen for the corresponding month in 2023 and 133 cents per dozen in January 2022 influenced by HPAI and demand. The relatively high values from the second through fourth quarters of 2022 compared to corresponding periods for the two previous years were due to depletion of hens following the emergence of HPAI coupled with a rise in demand following relaxation of COVID restrictions and the amplification of price rises due to the benchmark costing system.
- During February 2024, the feed component of production cost averaged 36.2 cents per dozen, down 3.9 percent or 1.5 cents per dozen from January 2024. During 2023 average feed cost was 46.4 cents per dozen compared to 50.1 cents per dozen in 2022 and 42.5 cents per dozen in 2021.
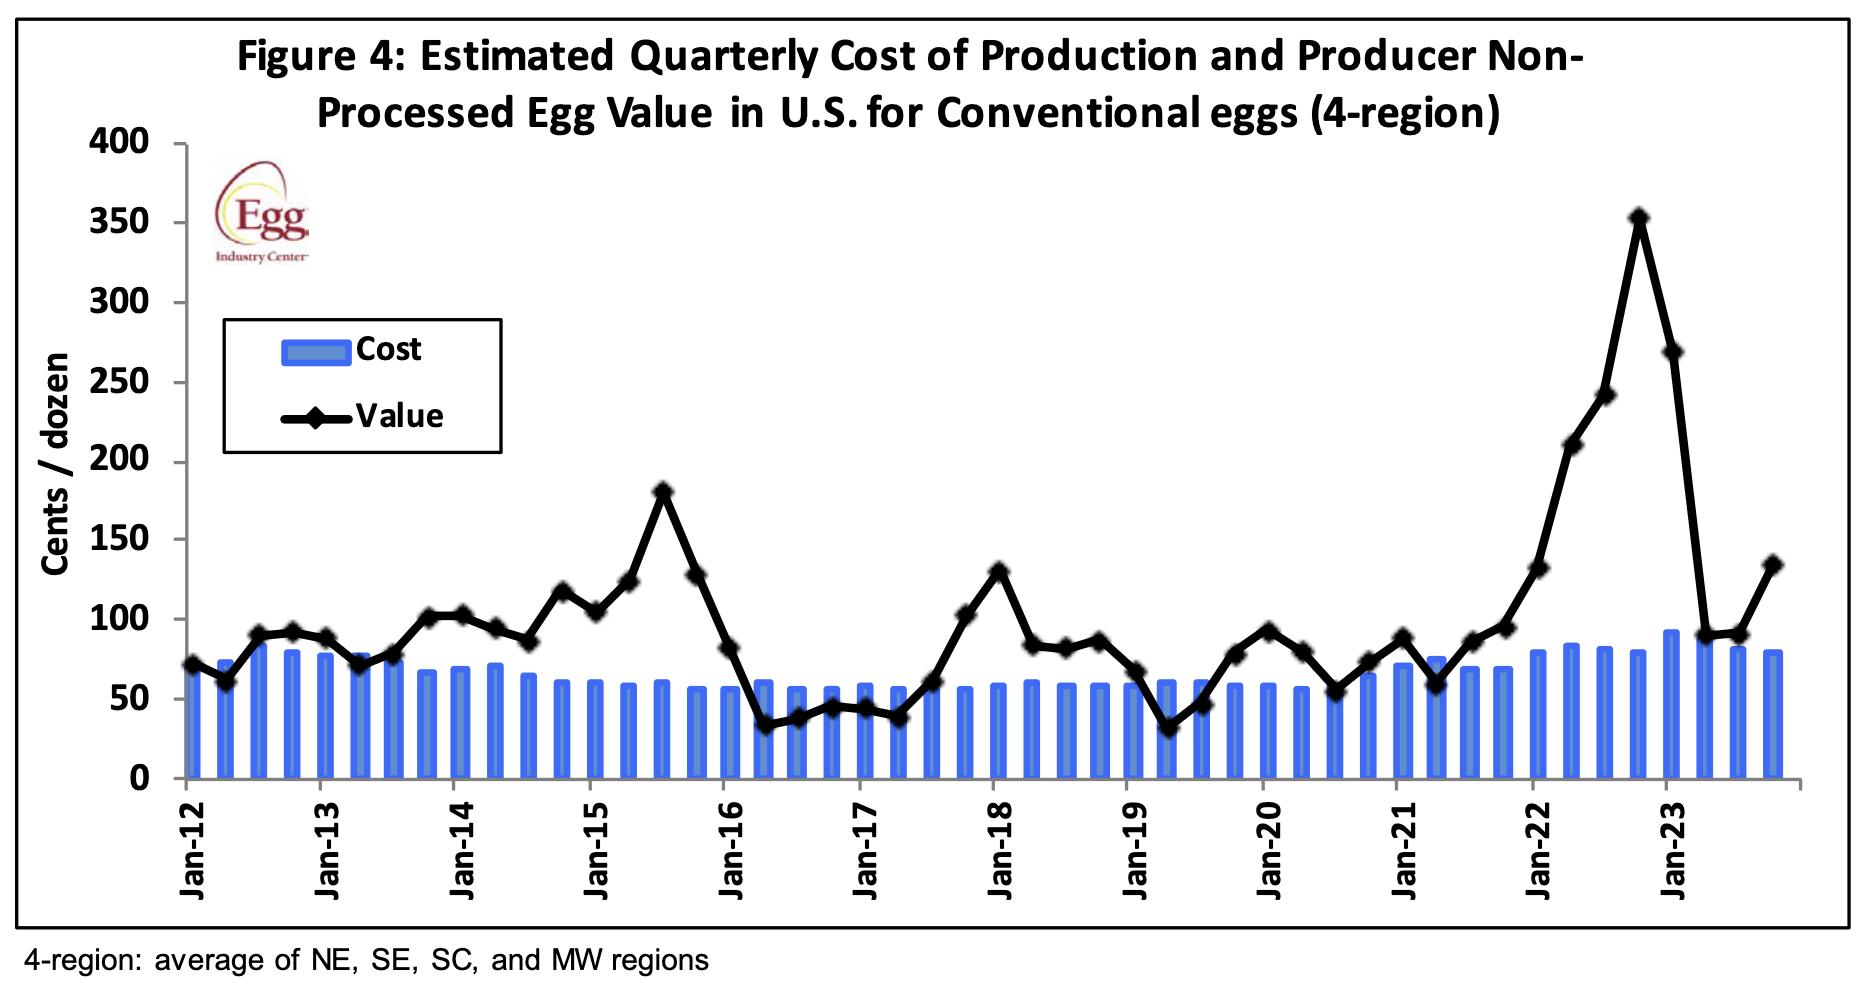
- Combining data from the USDA and the EIC, producers recorded a positive margin of 175 cents per dozen at farm-level for generic-egg flocks during February 2024. This compares with a margin of 94.4 cents per dozen in January 2024. Cumulative average monthly algebraic nest run margin for 2023 attained 71.5 cents. During 2022 cumulative average monthly algebraic margin attained 1,887 cents. For 2021 the cumulative average algebraic margin was 9.1 cents per dozen against USDA benchmark ‘nest run’ values.
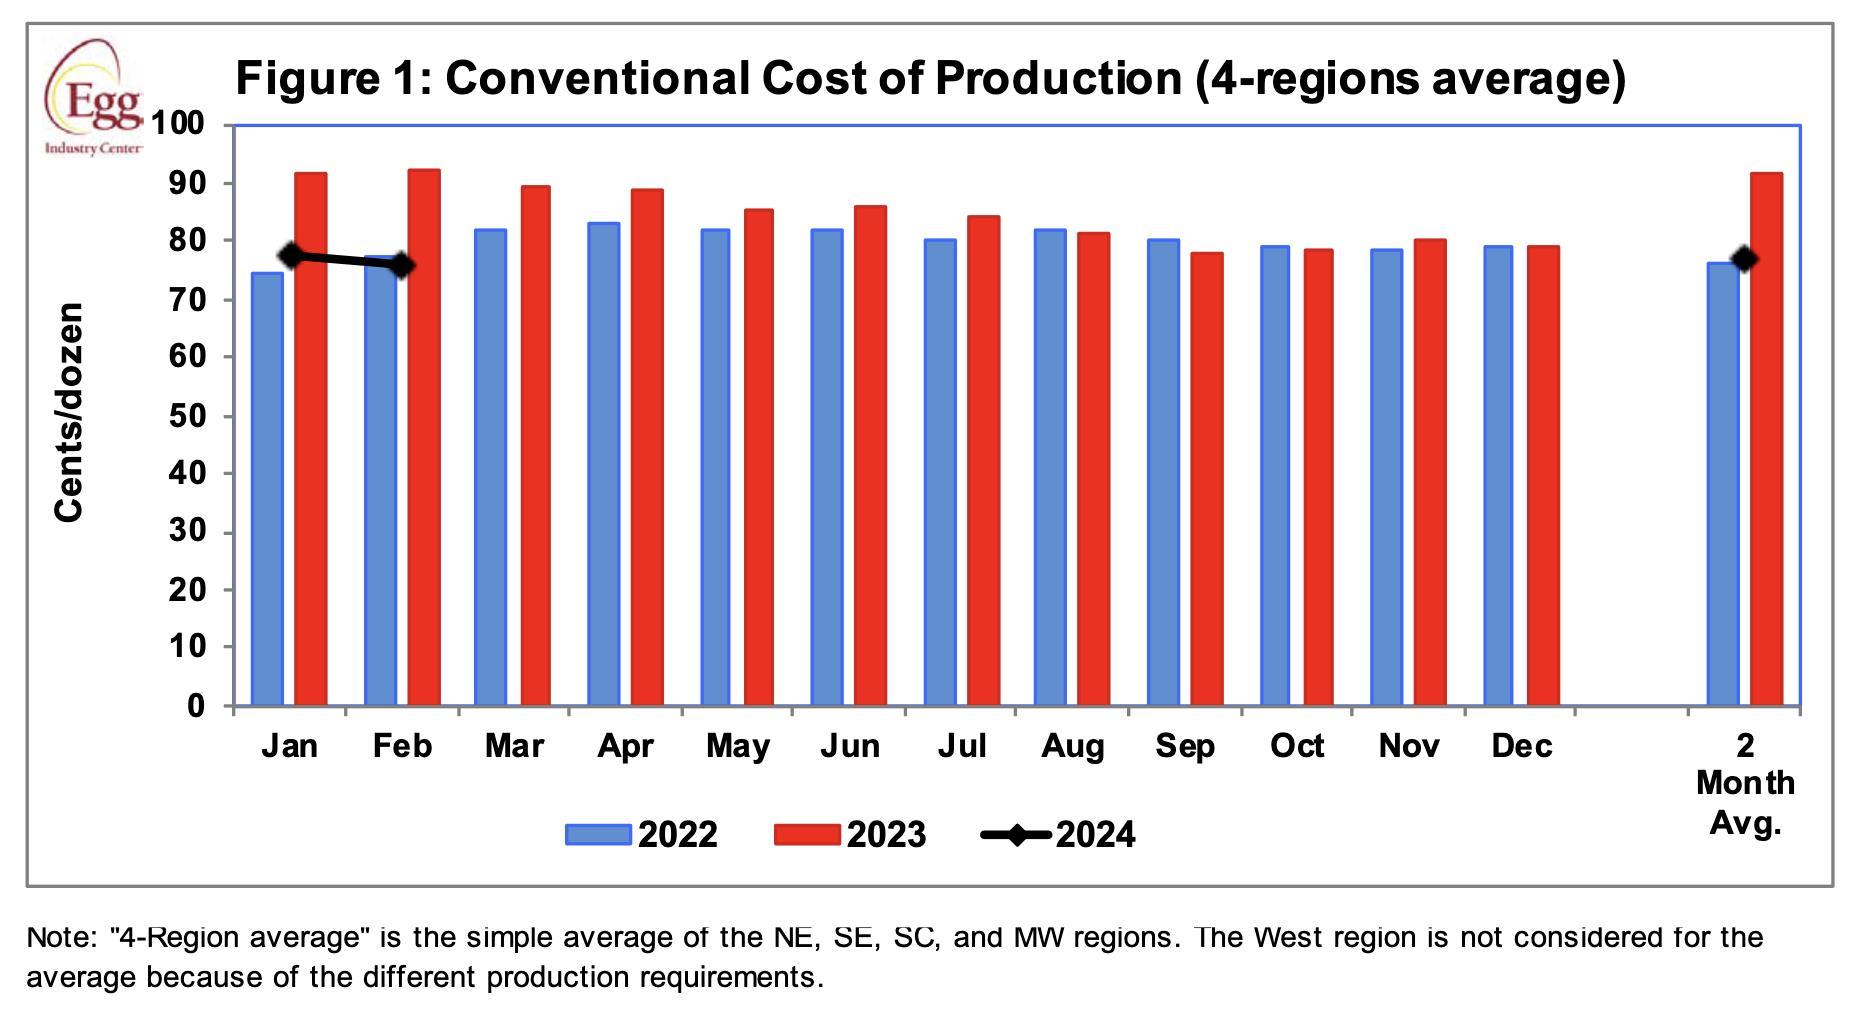
- The simple average price of feed in February 2024 over 5-regions was $236.15 per ton, lower by $8.20 per ton or 3.4 percent compared to January 2024. Southwest data is no longer disclosed to avoid compromising a company that predominates in Texas. The highest cost among five regions was the West at $284.09 per ton, down 1.7 percent from January 2024. This may be compared to the lowest-cost region, the Midwest at $213.47 per ton, down 4.1 percent from the previous month. The average cost for feed includes ingredients plus milling and delivery charges.
- The benchmark price of corn was $171.13 per ton in February 2024, down $8.71 per ton or 4.8 percent from the average January 2024 price, taking into account the difference in basis paid by producers. The differential in corn price between the Midwest and the West in February 2024 was $71.60 per ton. A 2.5 percent decrease of $9.83 per ton in the price of soybean meal to $388.32 per ton in February 2024 added to the lower price of corn in reducing feed and hence production cost. During February 2024 there was a differential of $70.62 per ton in feed price between the Midwest and the West compared to a difference of $66.52 per ton in January 2024 The industry has experienced sharp increases in the cost of phosphate additives, fat and vitamins since Mid- 2022.
- Feed price will continue to be a major factor driving production cost and hence margin. The March WASDE #646 in this edition, released on March 8th projected the volumes for the 2024 corn and soybean harvests, ingredient use, exports and ending stocks for the two major feed ingredients. Unknown factors influencing feed cost during the second quarter of 2024 will include:-
- Continued consequences of conflict in Ukraine and the Middle East with inevitable disruption in production and especially for shipping through the Black Sea and Suez Canal.
- Projections of crop yields in 2024 based on acreage planted and weather conditions. Transition to an El Nino event by mid-year msy result in hot and dry weather
- The projected large harvests in Brazil and Argentina.
- Demand by China will influence prevailing prices in international trade.
- The availability and hence prices of ingredients will also be influenced by weather conditions in the Southern Hemisphere and the U.S. following the transition to an El Nino event in the second quarter of 2024.
- Export volume from the U.S.
- Diversion of corn to ethanol and of soy oil to biodiesel.
- The economic and logistic effects associated with inflation.
There is obviously higher demand for ethanol with production projected by the U.S. Energy Information Administration at 970,000 barrels per day but with an average exceeding one-million barrels per day during 2023 extending through the first quarter of 2024. Substantial exports of soybeans to China, during the current 2023-2024 market year is supporting domestic price and hence cost of egg production. Each $10 per ton difference in feed cost represents approximately 1.70 cents per dozen. A change of $1 per ton (2.8 cents per bushel) in the price of corn is reflected in a 0.11 cent per dozen change in production cost. A $10 per ton change in the price of soybean meal affects production cost by 0.35 cent per dozen.
- The EIC calculated the 4-Region (excluding the West and Southwest) adjusted total nest-run production cost in February 2024 to be 76.0 cents per dozen, 4.1 cent per dozen lower than January 2024. Production costs for conventional eggs from caged flocks during February 2024 ranged from 74.1 cents per dozen in the Midwest up to a calculated value of 87.0 cents per dozen in the West, higher than the Midwest region by 13.0 cents per dozen. During 2023 the average monthly cost of production was 85.9 cents per dozen and 81.0 cents per dozen in 2022.
Deletion of Southwest and West data is considered a substantial deficiency of the EIC Report. Given the price of feed and with appropriate assumptions values for these regions could be determined. Exclusion of cost data skews the mean for the U.S.
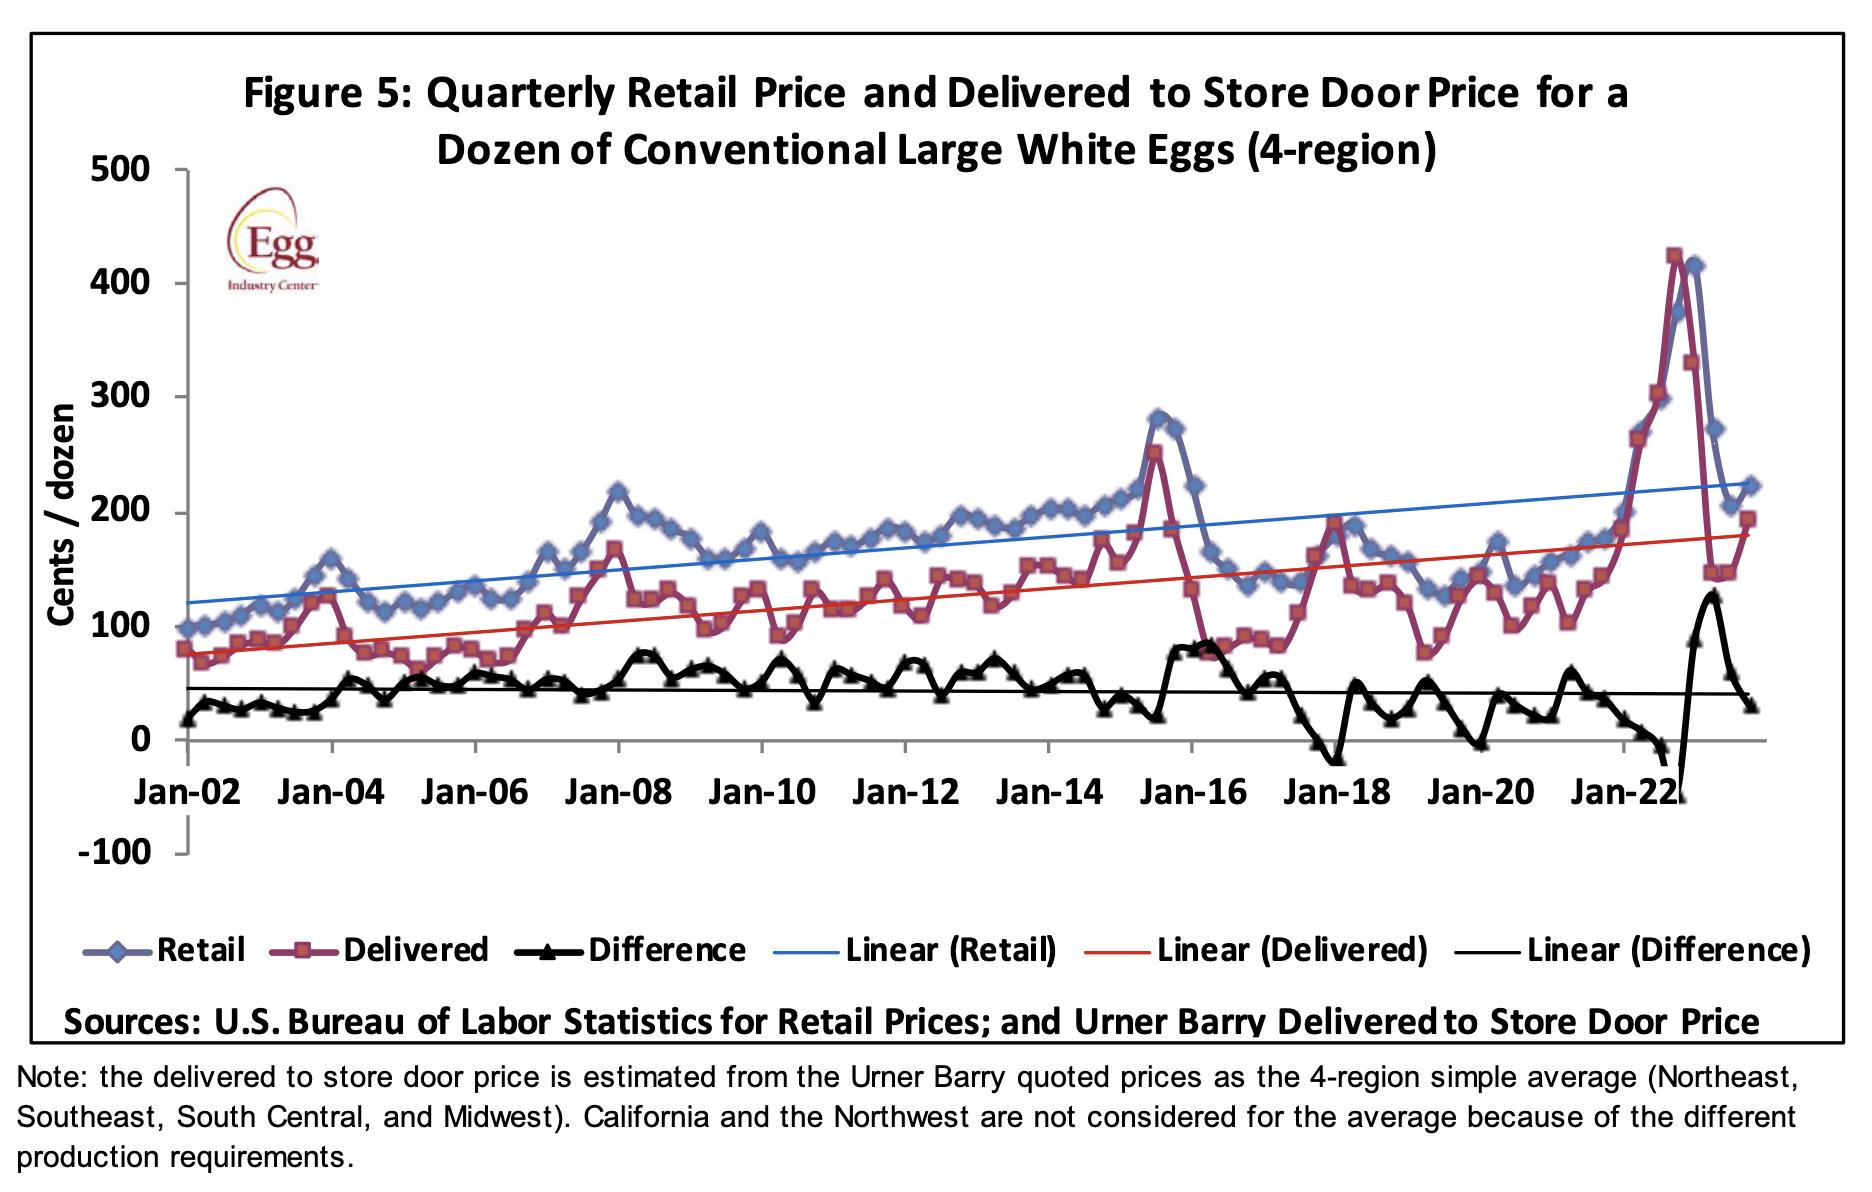
- National retail egg prices as determined by the Department of Commerce for January 2024 averaged 252 cents per dozen, up one cent per dozen compared to December 2023 During January 2022 and 2023 retail prices were respectively 193 and 482 cents per dozen. From 2017 through 2021 average retail prices did not decline in proportion to ex-farm prices, with chains imposing higher margins at retail, thereby depressing demand. Conventional supermarkets have recently demonstrated some restraint in pricing possibly due to competition from deep discounters and club stores, despite sustained demand.
EXPORT DATA FOR JANUARY 2024 COMBINING ALL EGGS.
- The monthly Export Report is posted in this edition and under the STATISTICS Tab thereafter.
- It is presumed that shell egg and egg product exports are mainly from caged hens.
- According to USDA-FAS data, 132,000 cases of shell eggs were exported in January 2024, representing 0.6 percent of total production. This was a 47.2 percent decrease compared to December 2023 attributed to higher prevailing domestic prices. The decrease in exports was attributed to fewer cases shipped to Canada, (-57%) and Mexico (-25%) the two largest importers representing 67 percent of January 2024 shipments.
- Exports of egg products in January 2024 attained 262,000 case-equivalents down 26.1 percent from the previous month, representing 1.2 percent of U.S. output. Decreases were attributed to lower volumes expressed in case equivalents to Canada, down 33,000; the E.U., down 24,000; S. Korea, down 12,000, and to Japan, down 34,000.
- Collectively, exports of shell eggs and products in January 2024 comprised the output from approximately 5.2 million hens in production during the month, attaining 394,000 case-equivalents, down 34.8 percent from December 2023 and 33.8 percent less than combined exports during the pre-HPAI first quarter of 2022 averaging 596,300 case equivalents per month.
- Maintaining export volume is attributed to cooperation between the AEB and USAPEEC, in existing, new and potential markets. Specific attention is directed to nations with the potential to import U.S. product based on landed price against competition. Exports of both egg-products and shell eggs in January 2024 corresponded to 1.2 percent of a nominal national flock of approximately 303 million producing hens, (after adjustment for Q4 2023 HPAI depletions) on commercial farms holding more than 30,000 hens.
- There is no scientifically justifiable reason why any nation should embargo pasteurized egg products from an approved plant, based on a diagnoses of H5 or H7 avian influenza or velogenic Newcastle disease in a specific state or country.